I Need Weekly Drone Maps for My Tampa Bay Construction Site - Here's What to Expect
What to expect when you hire a drone pilot for weekly construction site mapping in Tampa Bay. Deliverables, pricing, and how the process works from start to finish.
If you're a general contractor or developer running an active construction site in the Tampa Bay area and you need consistent weekly aerial documentation, here's the short version: a FAA Part 107 certified drone pilot flies your site on the same day each week, captures hundreds of high-resolution images, and delivers a 2D orthomosaic map, 3D site model, and progress photos, typically within 48 hours. The cost depends on site size, but monthly retainers for weekly visits start at $1,499 for sites up to 10 acres. Here's how the whole process works from start to finish.
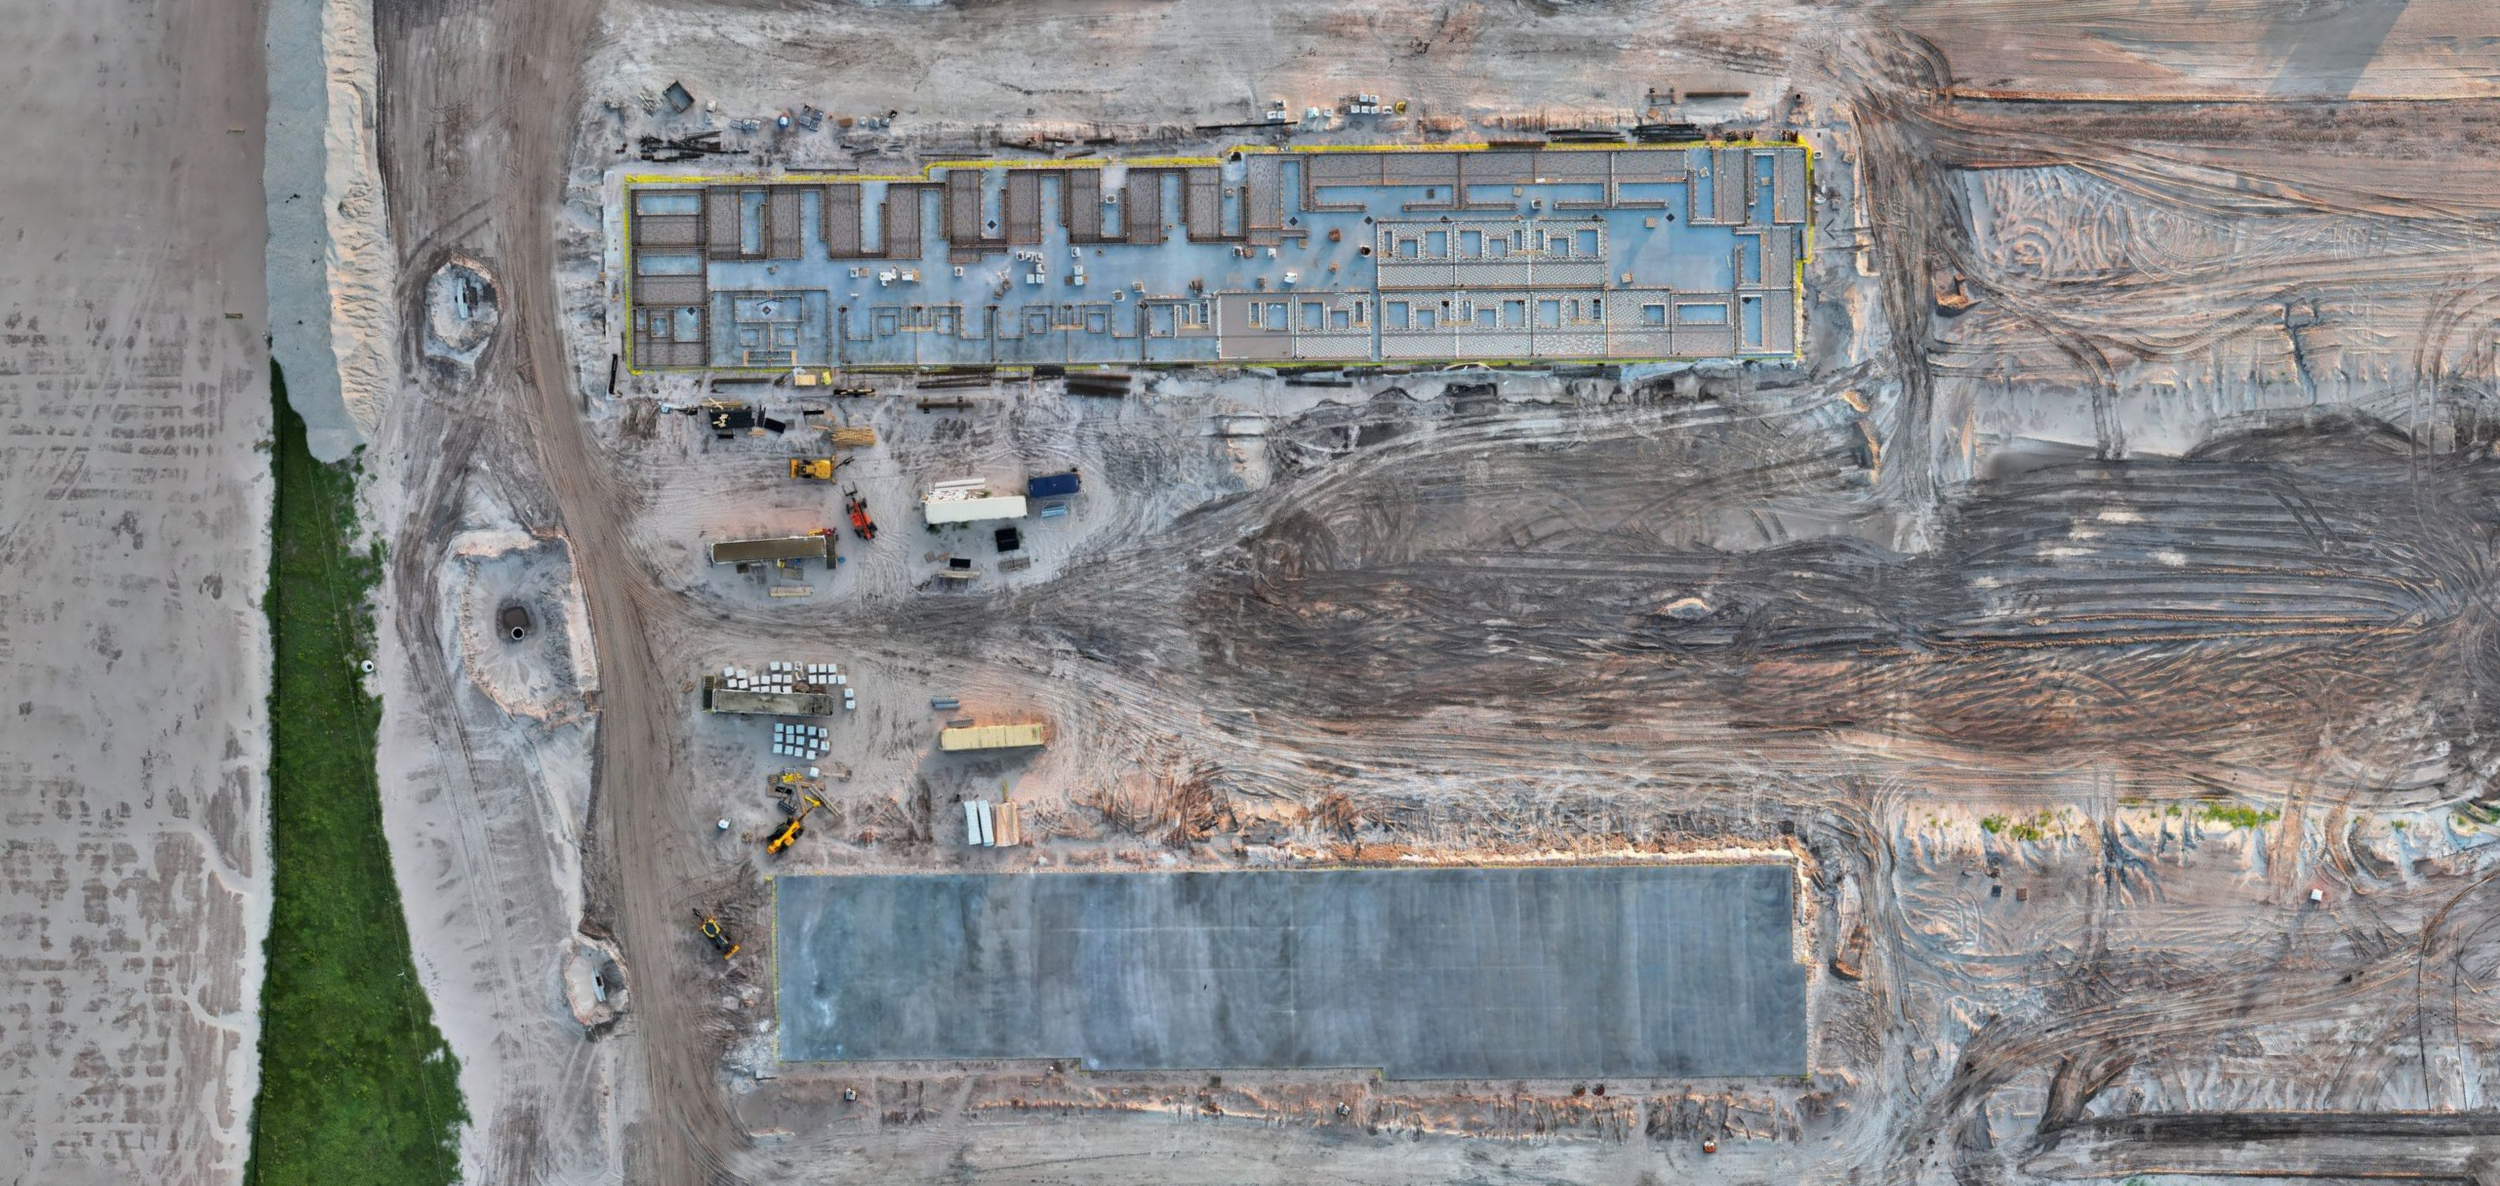
Aerial 2D orthomosaic of a construction site in the Tampa Bay area - captured and processed by RARI Drones with DroneDeploy.
How Does Weekly Drone Mapping Actually Work?
The process is simple and designed to require zero effort from your team on the ground.
We establish a recurring flight schedule on the same day and time each week, so it becomes part of your project rhythm. Before each visit, we check airspace authorization through LAANC, review NOTAMs, and evaluate weather conditions. If conditions aren't safe to fly, we reschedule within 24 hours.
On site, the flight itself typically takes 20 to 45 minutes depending on acreage. The drone flies an automated mission plan at a consistent altitude, capturing overlapping images that get stitched together into one seamless, measurable map of your entire site. We use the same flight plan every week so your maps are directly comparable over time, and you can literally overlay them to see exactly what changed.
What Deliverables Will I Receive Each Week?
Every weekly visit includes the same full set of deliverables:
1. 2D Orthomosaic Map - One high-resolution, geometrically corrected aerial image of your entire site. Every inch captured, measurable, and georeferenced. This isn't a photo stitched together in someone's phone, it's survey-grade aerial data processed through DroneDeploy with sub-centimeter RTK accuracy.
Not sure what an orthomosaic is? Here's a breakdown of what you're getting and why it matters.
2. Interactive Map Link - A shareable link your team, investors, and stakeholders can open in any browser. You can zoom in, measure distances, and compare to previous weeks. No software required.
3. 3D Site Model (if included in your package) - A three-dimensional model of the site generated from oblique aerial imagery. Useful for stakeholder presentations, volumetric analysis, and visualizing vertical progress as structures go up.
4. Progress Photos - Key detail shots of specific areas: foundations, framing, grading, staging areas, and equipment positions.
5. All Source Files Available Upon Request - GeoTIFF, DSM, KMZ, and all raw processed files are available if your team needs them for integration with your own software or surveyor coordination.
3D site model of a Tampa Bay construction site, generated from aerial drone imagery and processed through DroneDeploy.
How Accurate Is the Data?
We fly a DJI Matrice 4TD with RTK connected to the Florida Department of Transportation CORS network. In plain English, our maps achieve sub-centimeter horizontal and vertical accuracy. This is survey-grade data, not a rough estimate from a consumer drone.
All elevation data is processed in NAVD88 US Survey Feet, which matches the same vertical datum your surveyors and engineers are using. Your drone maps and your survey data speak the same language.
What Do General Contractors Actually Use This For?
Weekly aerial maps aren't just nice pictures for your wall. Here's how GCs and developers in Tampa Bay are using them:
Investor and Stakeholder Reporting: Instead of walking an investor around a muddy job site, send them a link to an interactive map showing exactly where the project stands. Weekly comparison maps show clear, visual progress that builds confidence.
Lender Draw Requests: Banks and lenders increasingly want visual documentation to support draw requests. A time-stamped, georeferenced aerial map is more credible than ground-level photos.
Change Order Documentation: When a subcontractor claims work was completed or a dispute arises about site conditions, your weekly maps become a timestamped, objective record that can protect you from costly disputes.
Progress Tracking: Compare this week's map to last week's. See exactly how much grading was completed, where materials moved, and whether work is tracking to schedule. No ambiguity.
Safety and Compliance: Aerial views reveal safety concerns that aren't visible from the ground such as improper material storage, erosion control failures, and unauthorized access points.
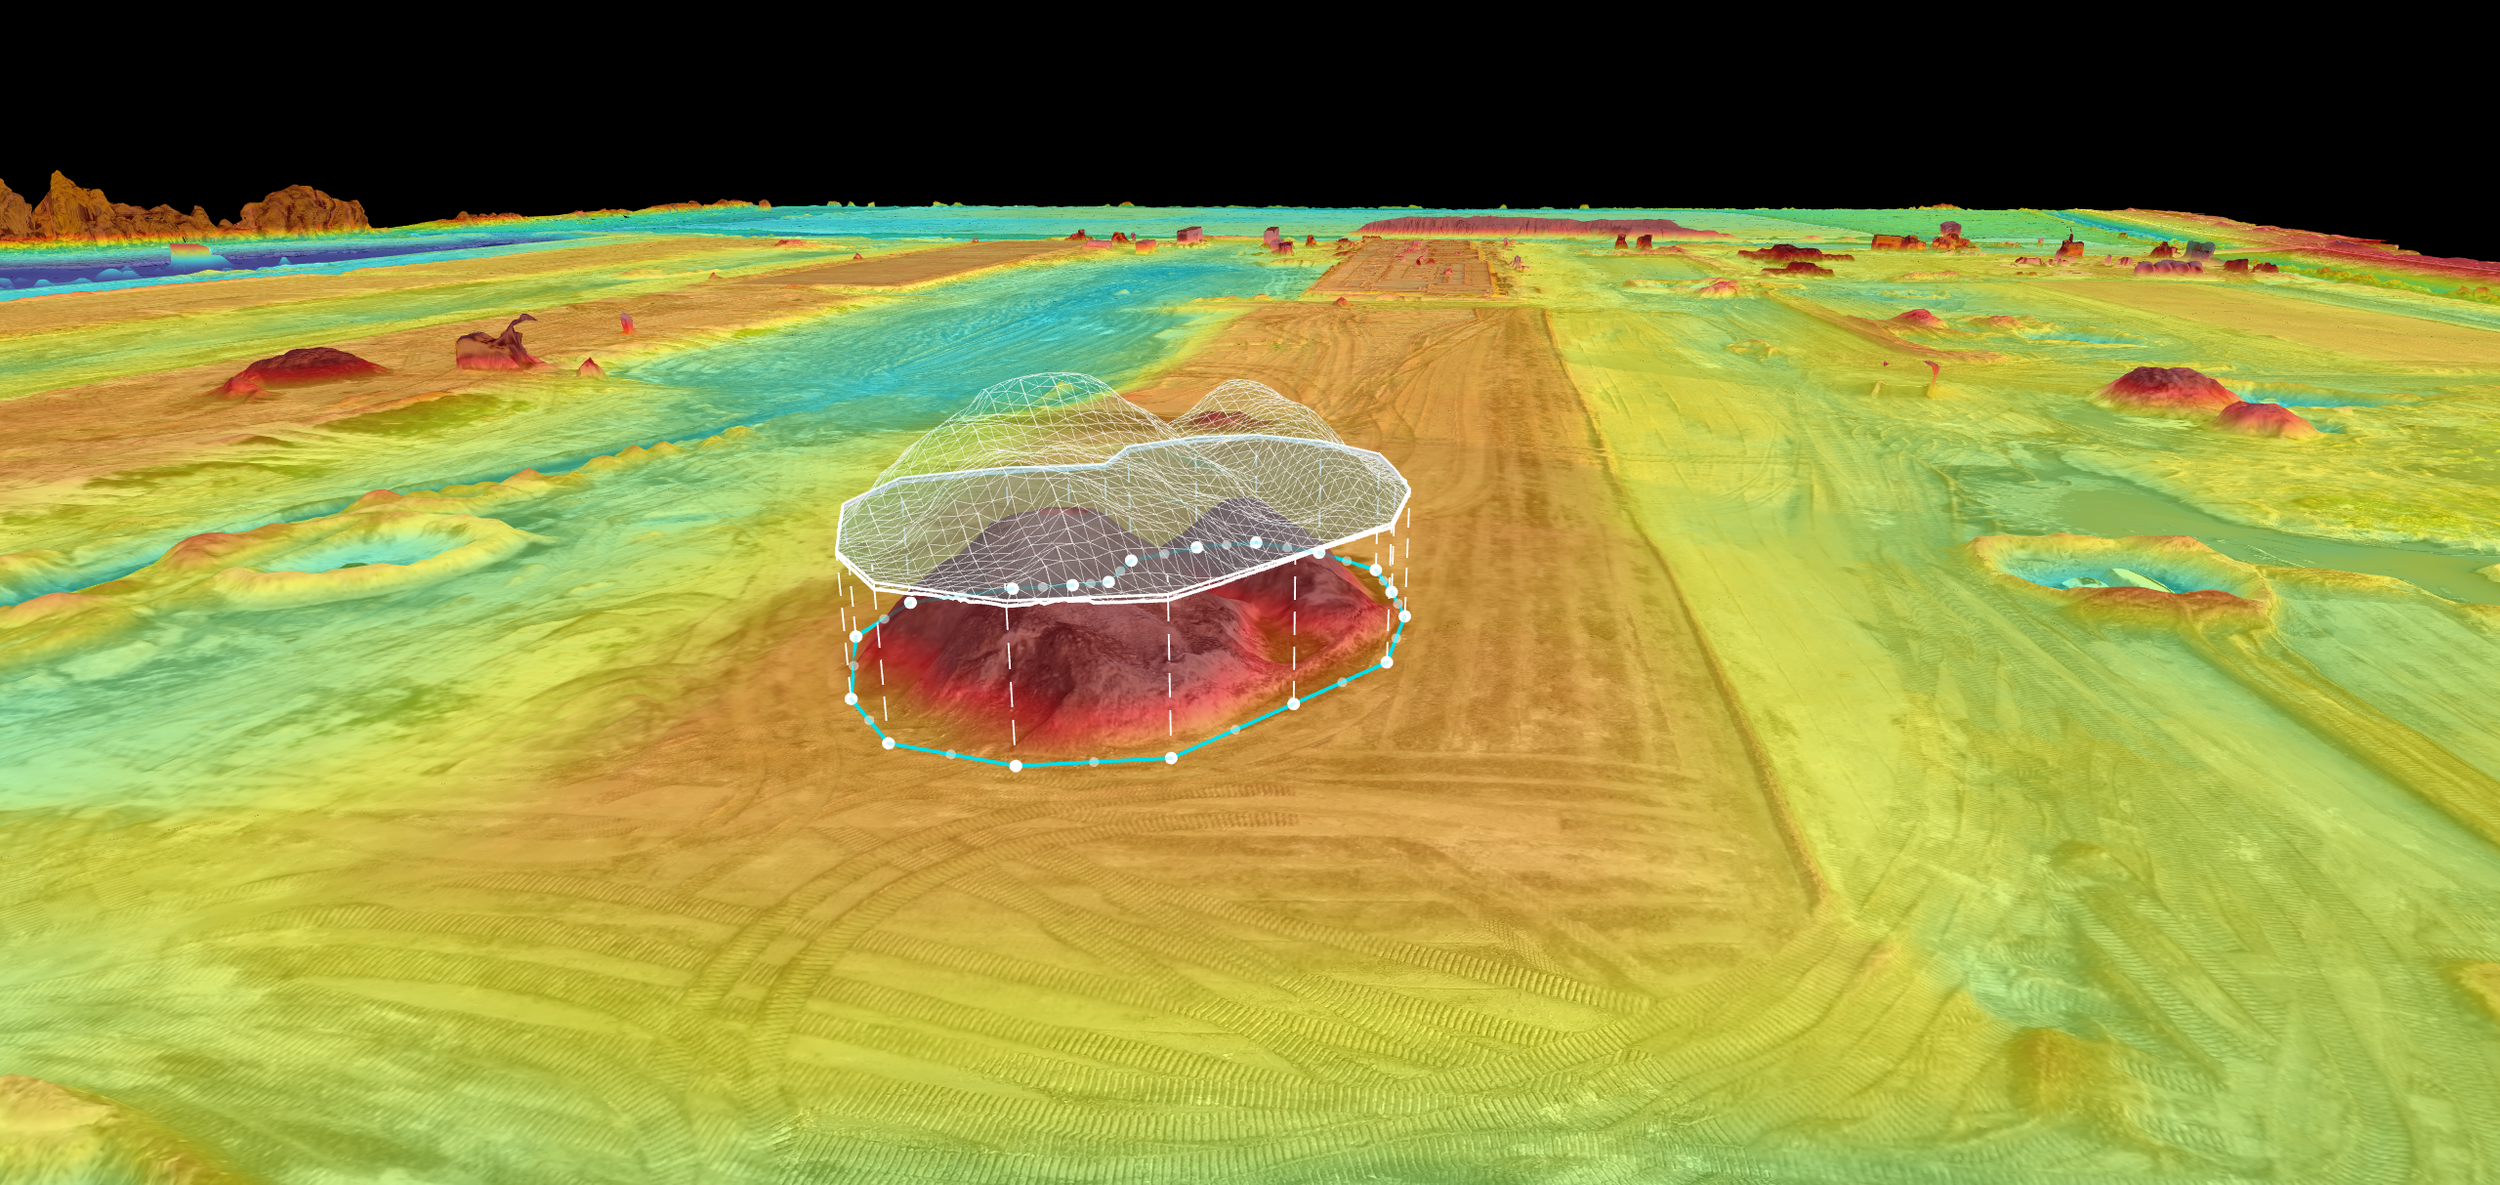
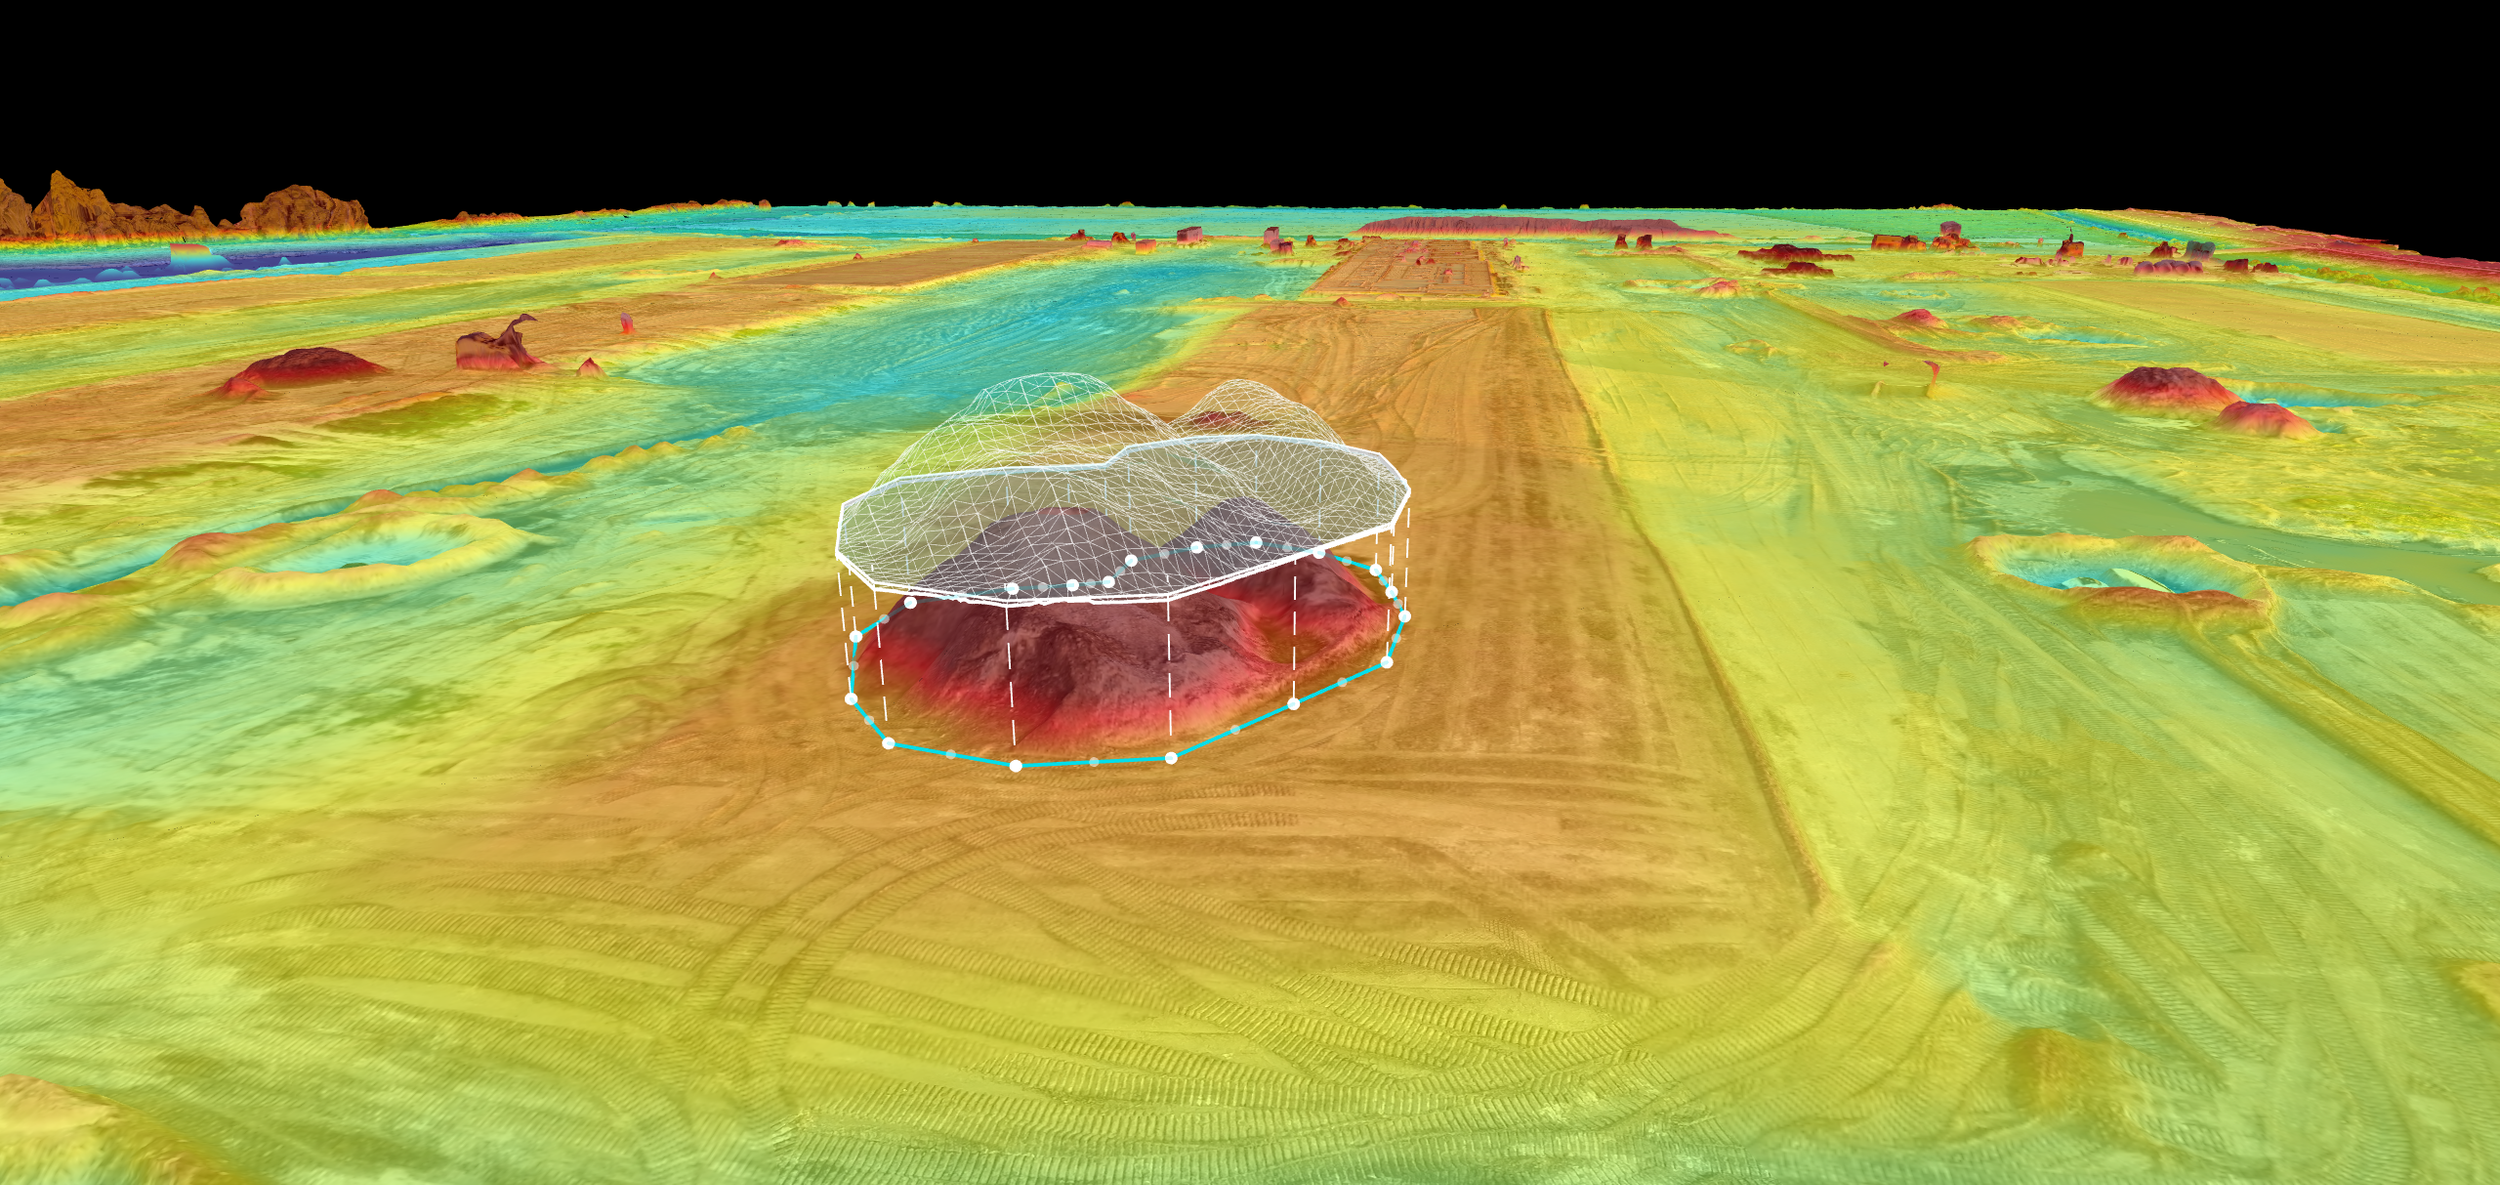
Elevation mapping with stockpile volume measurement. Color-coded terrain data from a construction site.
How Much Does Weekly Drone Mapping Cost in Tampa Bay?
Pricing depends on site size and deliverable package. Here's a general framework for Tampa Bay:
2D Mapping (Ortho + Interactive Map + Progress Photos + All Files):
Up to 10 acres: $1,499/month
10–25 acres: $2,199/month
25–50 acres: $2,999/month
50+ acres: Custom quote
3D Site Model (Everything in 2D + Dedicated Oblique Mission + True 3D):
Up to 10 acres: $2,299/month
10–25 acres: $3,499/month
25–50 acres: $4,499/month
50+ acres: Custom quote
Monthly retainers include weekly visits. Most months that's 4 visits, but months with 5 weeks include 5 visits at no extra charge. That's roughly 1.5 free visits compared to paying per visit, and over a year you get approximately 12 additional visits included.
One-time flyovers are also available if you need a single map, rather than ongoing documentation.
Can I See a Sample Before I Commit?
Yes. We offer a free consultation where we walk you through sample deliverables from previous projects so you can see exactly what you'll receive. We can also discuss a one-time trial flyover of your site so you can evaluate the data quality before committing to a monthly retainer.
What About Bad Weather or No-Fly Days?
Florida weather is unpredictable, we get it. If conditions prevent a safe flight on your scheduled day (rain, high winds, or temporary flight restrictions), we reschedule within 24 hours. You never lose a visit. Safety comes first, and we will never fly in conditions that compromise data quality or risk equipment over your site.
How Is This Different from Hiring a Photographer with a Drone?
A photographer with a drone gives you pretty pictures. We give you measurable, georeferenced, survey-grade data processed through professional photogrammetry software.
The difference matters when your investor asks "how many cubic yards of fill were moved this week" or when a subcontractor disputes a change order. A photograph can't answer those questions. An orthomosaic with RTK accuracy can.
We also bring 15+ years of thermal imaging experience from a career in fire rescue, which means if your project ever needs thermal documentation, we handle that too.
What Areas Do You Cover?
RARI Drones serves construction sites across the Tampa Bay region, including Hillsborough, Pinellas, Pasco, Hernando, and Manatee counties. We're based in Pasco County and most job sites are within 30 to 45 minutes. Sites outside our core service area? We still fly, just reach out and we'll work out the details.
How Do I Get Started?
Three steps:
1. Contact us for a free consultation. Tell us about your project including site location, acreage, timeline, and what you need documented.
2. We'll visit the site and establish the flight plan. Once the plan is locked, it stays consistent every week.
3. Weekly flights begin. Same day, same time, deliverables in your inbox within 48 hours.
Ready to see what weekly aerial documentation can do for your project?
Why General Contractors and Developers Are Using Weekly Drone Mapping on Construction Sites
Construction sites change fast. Weekly drone mapping gives general contractors and developers consistent aerial documentation to track progress, verify earthwork, and keep every stakeholder aligned, without setting foot on site.
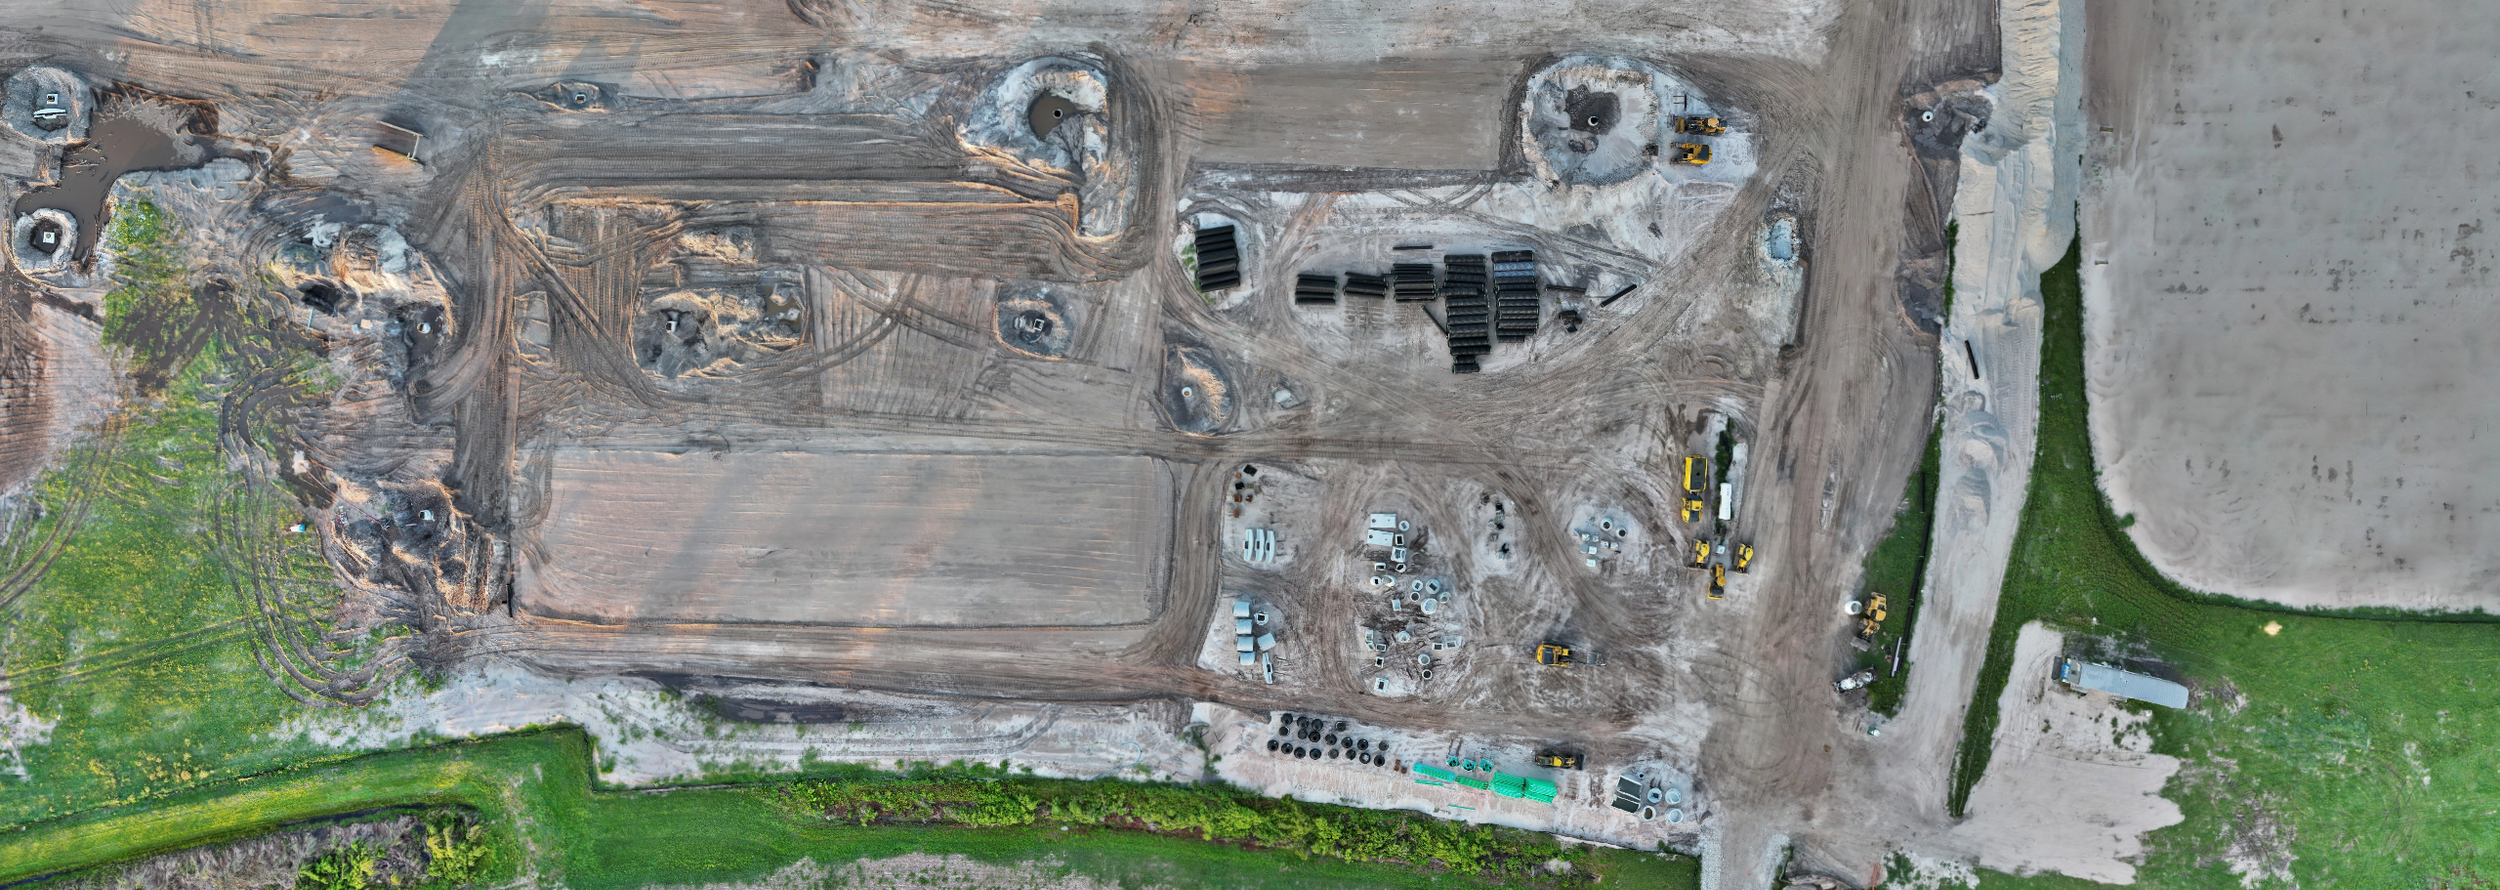
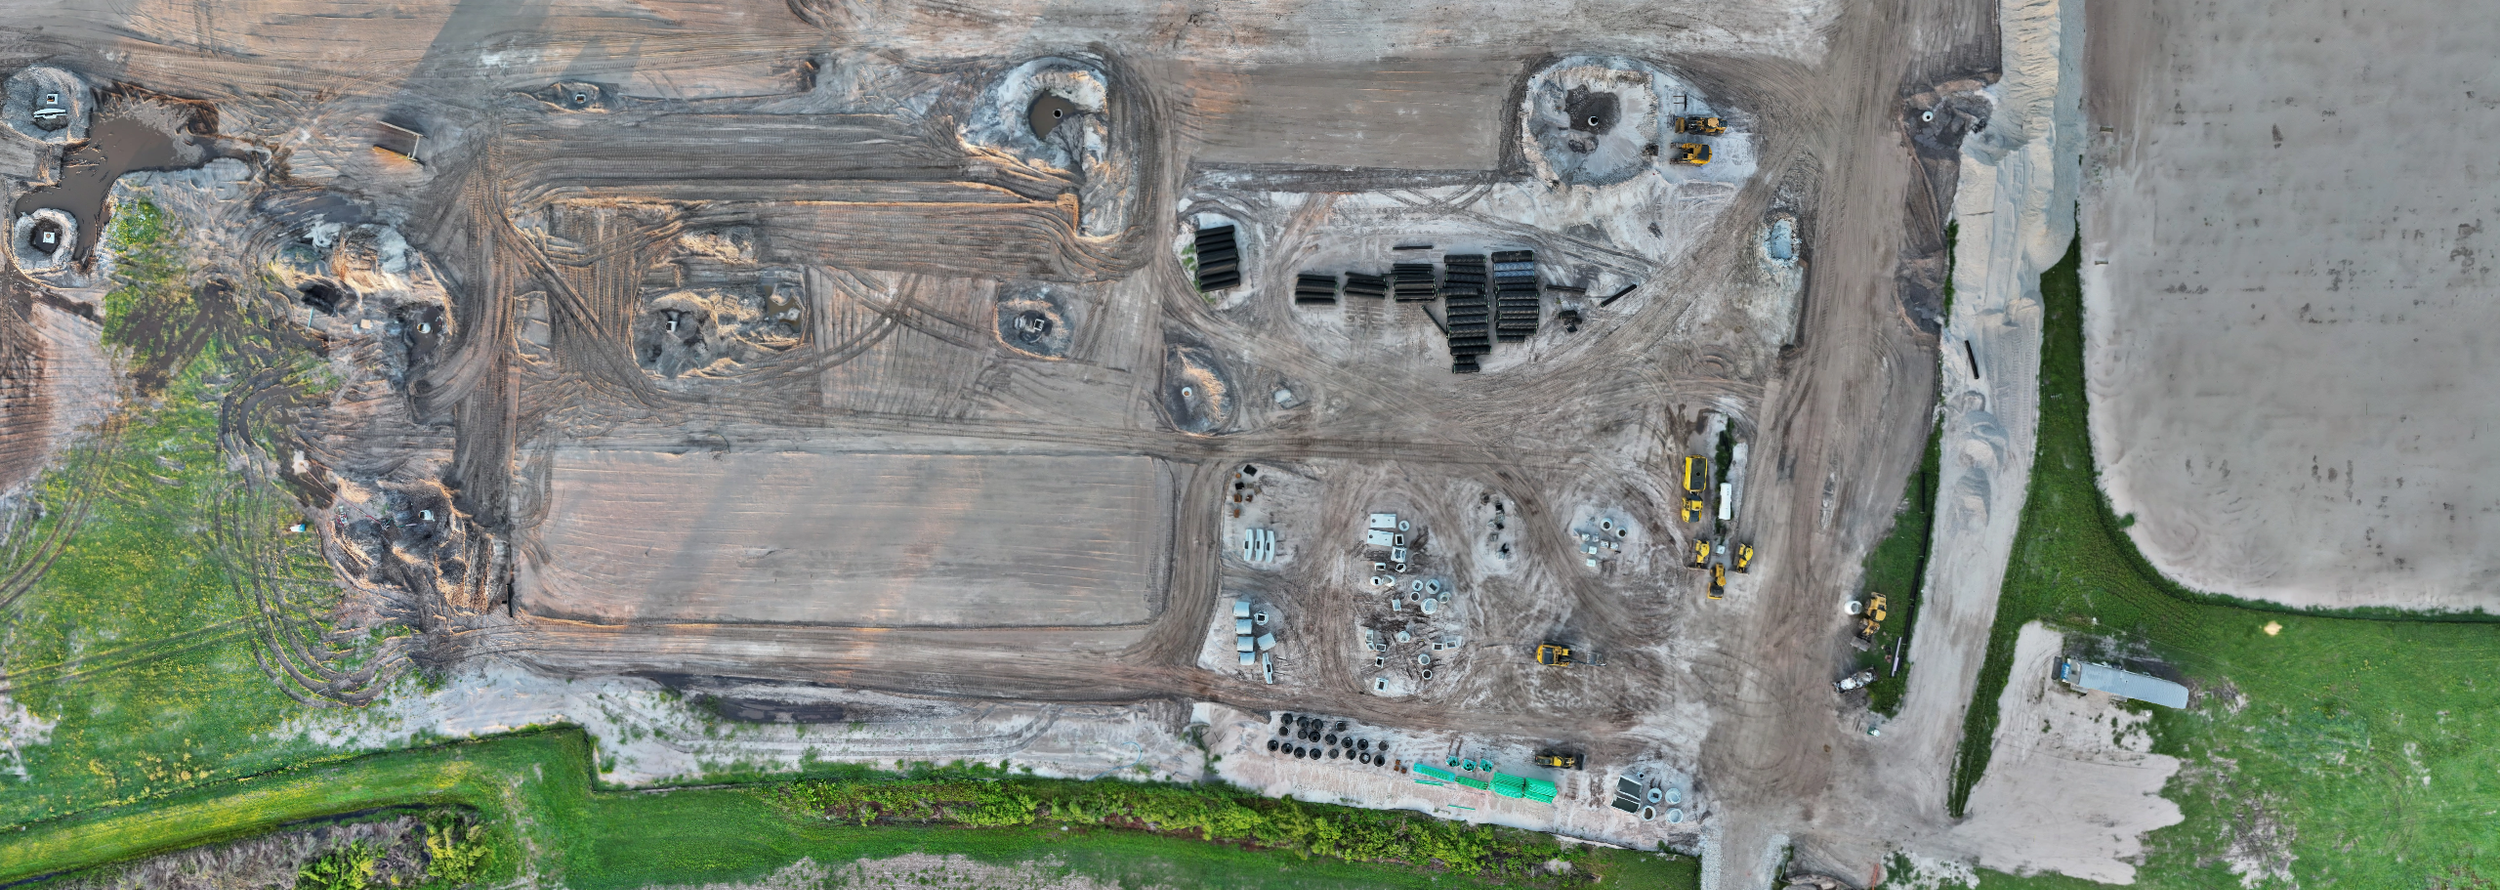
Aerial view of a construction staging site captured by RARI Drones, showing the level of detail weekly drone mapping provides to project managers, GC’s, and developers.
The Job Site Is Changing Every Day. Your Documentation Should Too.
A construction site doesn't sit still. Earthwork gets moved, concrete gets poured, steel goes vertical, and somewhere between the first grading pass and the final punch list, things happen. Whether it be delays, disputes, weather events, or change orders, that costs real money when there's no documentation to back up what actually occurred.
That's why general contractors and developers across Tampa Bay and nationwide are adding weekly drone mapping to their project workflows. Not as a luxury, but as a standard operating procedure.
A Single Flight Gives You a Snapshot. Weekly Flights Give You a Timeline.
If you've ever had a drone flown over your site, you know the images are impressive. But a one-time flight only tells you what the site looked like on that one day. Weekly flights change the game entirely. They build a visual timeline of your entire project, from first dirt to final inspection.
Every week becomes a chapter in your site’s story. And when you need to go back to answer a question: “When was that slab poured?” “Was the east pad graded before or after the storm?” You don't rely on memory or search through hundreds or thousands of images trying to recall. You pull up that week's data and instantly see it for yourself.
What Weekly Mapping Actually Solves.
Not familiar with the mapping deliverables we're talking about? Orthomosaics, 3D models, elevation data? Read our breakdown of what a 2D orthomosaic is and what you actually receive → https://www.raridrones.com/insights/what-is-a-2d-orthomosaic
Dispute Resolution With Evidence, Not Arguments.
A subcontractor says they were on schedule, but the timeline says otherwise. Weekly maps create an indisputable visual record that holds up when conversations get difficult. No interpretation needed as the data speaks for itself.
Stakeholder Updates Without the Site Visit.
Investors, lenders, and ownership groups want to see progress. Instead of coordinating site visits, scheduling walkthroughs, and hoping the weather cooperates, you can send them an interactive map link. They can see the entire site from their phone or their office. Professional, efficient, and always current.
Safety and Compliance Documentation.
When it comes to OSHA compliance, stormwater management, erosion control, or even perimeter fencing, weekly aerials capture it all. If a safety question comes up six months from now, you've got the visual record to prove what was in place and when.
Earthwork and Grading Verification.
Is the site graded to spec? Where's the fill short? Where's the drainage pooling? Elevation data from weekly flights shows exactly what's happening across the entire parcel, not just the section the surveyor walked.
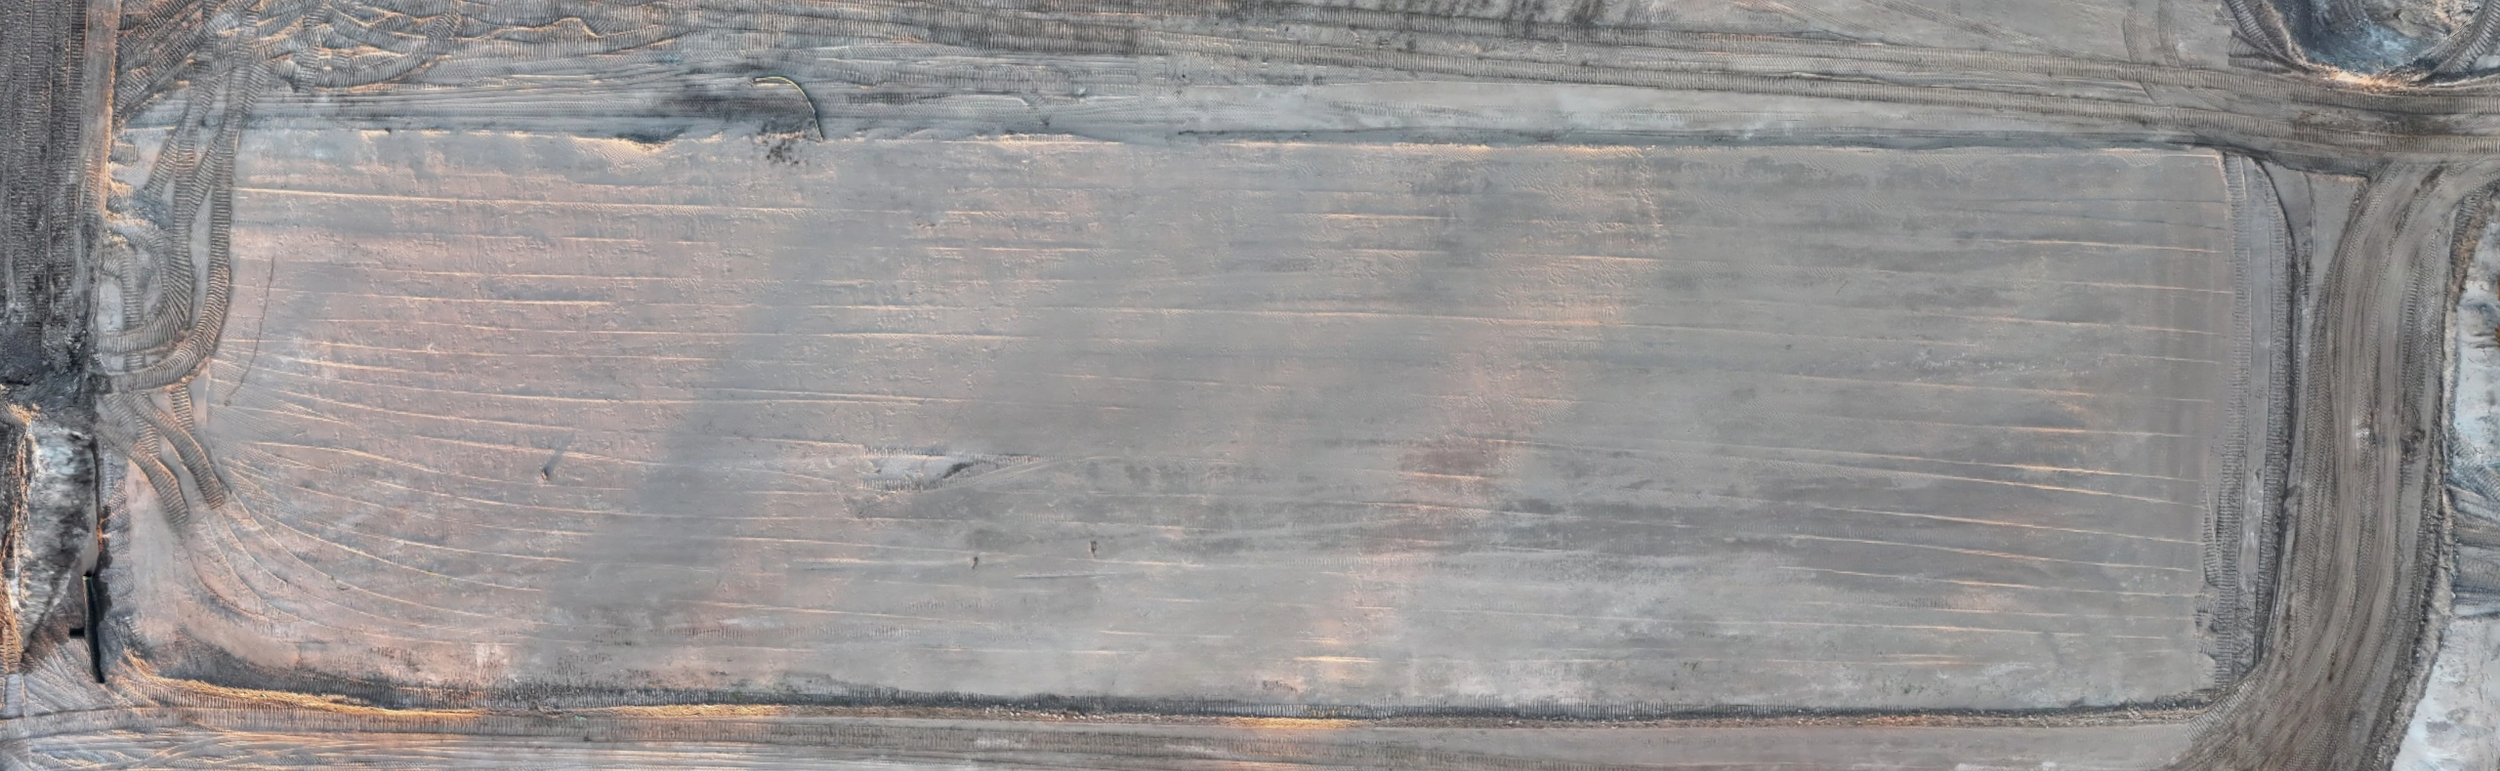
Drone-captured aerial view of earthwork and grading progress. Weekly mapping tracks elevation changes and compaction across the entire site.
Weather Event Documentation.
Florida is beautiful, but we get hit and builds are no different. Whether it be hurricanes, tropical storms, or just heavy rain events, they can set a project back weeks. A drone flight immediately after a weather event captures the damage, the standing water, and the displaced materials. When compared to the previous flight and map before the event, that documentation supports insurance claims and schedule adjustments with real evidence.
How It Works.
The process is designed to be simple and stay out of your crew's way:
Schedule: We establish a recurring flight day that works with your site’s operations. Early morning flights before crews arrive are ideal so there is zero disruption to your workflow.
Fly: A single flight mission covers the entire site in 15–30 minutes depending on acreage. RTK-enabled GPS provides sub-centimeter positioning accuracy on every image.
Process: Images are processed into your full deliverable package.
Deliver: Everything is returned within 48 hours. Shareable links, downloadable files, and organized folders. Whatever format works best for your team.
Repeat: Every flight follows the same plan, on the same schedule, giving you consistent data you can compare week over week for the life of the project.
What Does It Cost?
Less than most people think. A weekly drone mapping retainer typically costs less than a single day of conventional survey work, and delivers a broader dataset every single week.
For most general contractors and developers, the question isn't whether drone mapping fits the budget. It's how much the lack of documentation has already cost them in disputes, rework, and miscommunication.
Built for Florida Construction.
Tampa Bay's construction market moves fast. Between the growth in Pasco, Hillsborough, Pinellas, Hernando, and Manatee counties, there's no shortage of active sites, and no shortage of projects where better documentation would have saved time, money, and headaches.
RARI Drones operates primarily in the Tampa Bay region. We know the airspace, the weather patterns, and the pace of construction in this market. Every flight is conducted by an FAA Part 107 licensed pilot with RTK precision GPS and commercial-grade equipment.
The Bottom Line.
Weekly drone mapping isn't about having cool aerial photos of your job site. It's about building an airtight visual record that protects your project, informs your team, and gives every stakeholder the clarity they need, every single week.
One flight. Full coverage. 48-hour turnaround. No disruption to your crew.
Ready to see what weekly mapping looks like on your site? Request a free consultation below, and we’ll even map your site as a demo so you can see the data firsthand.
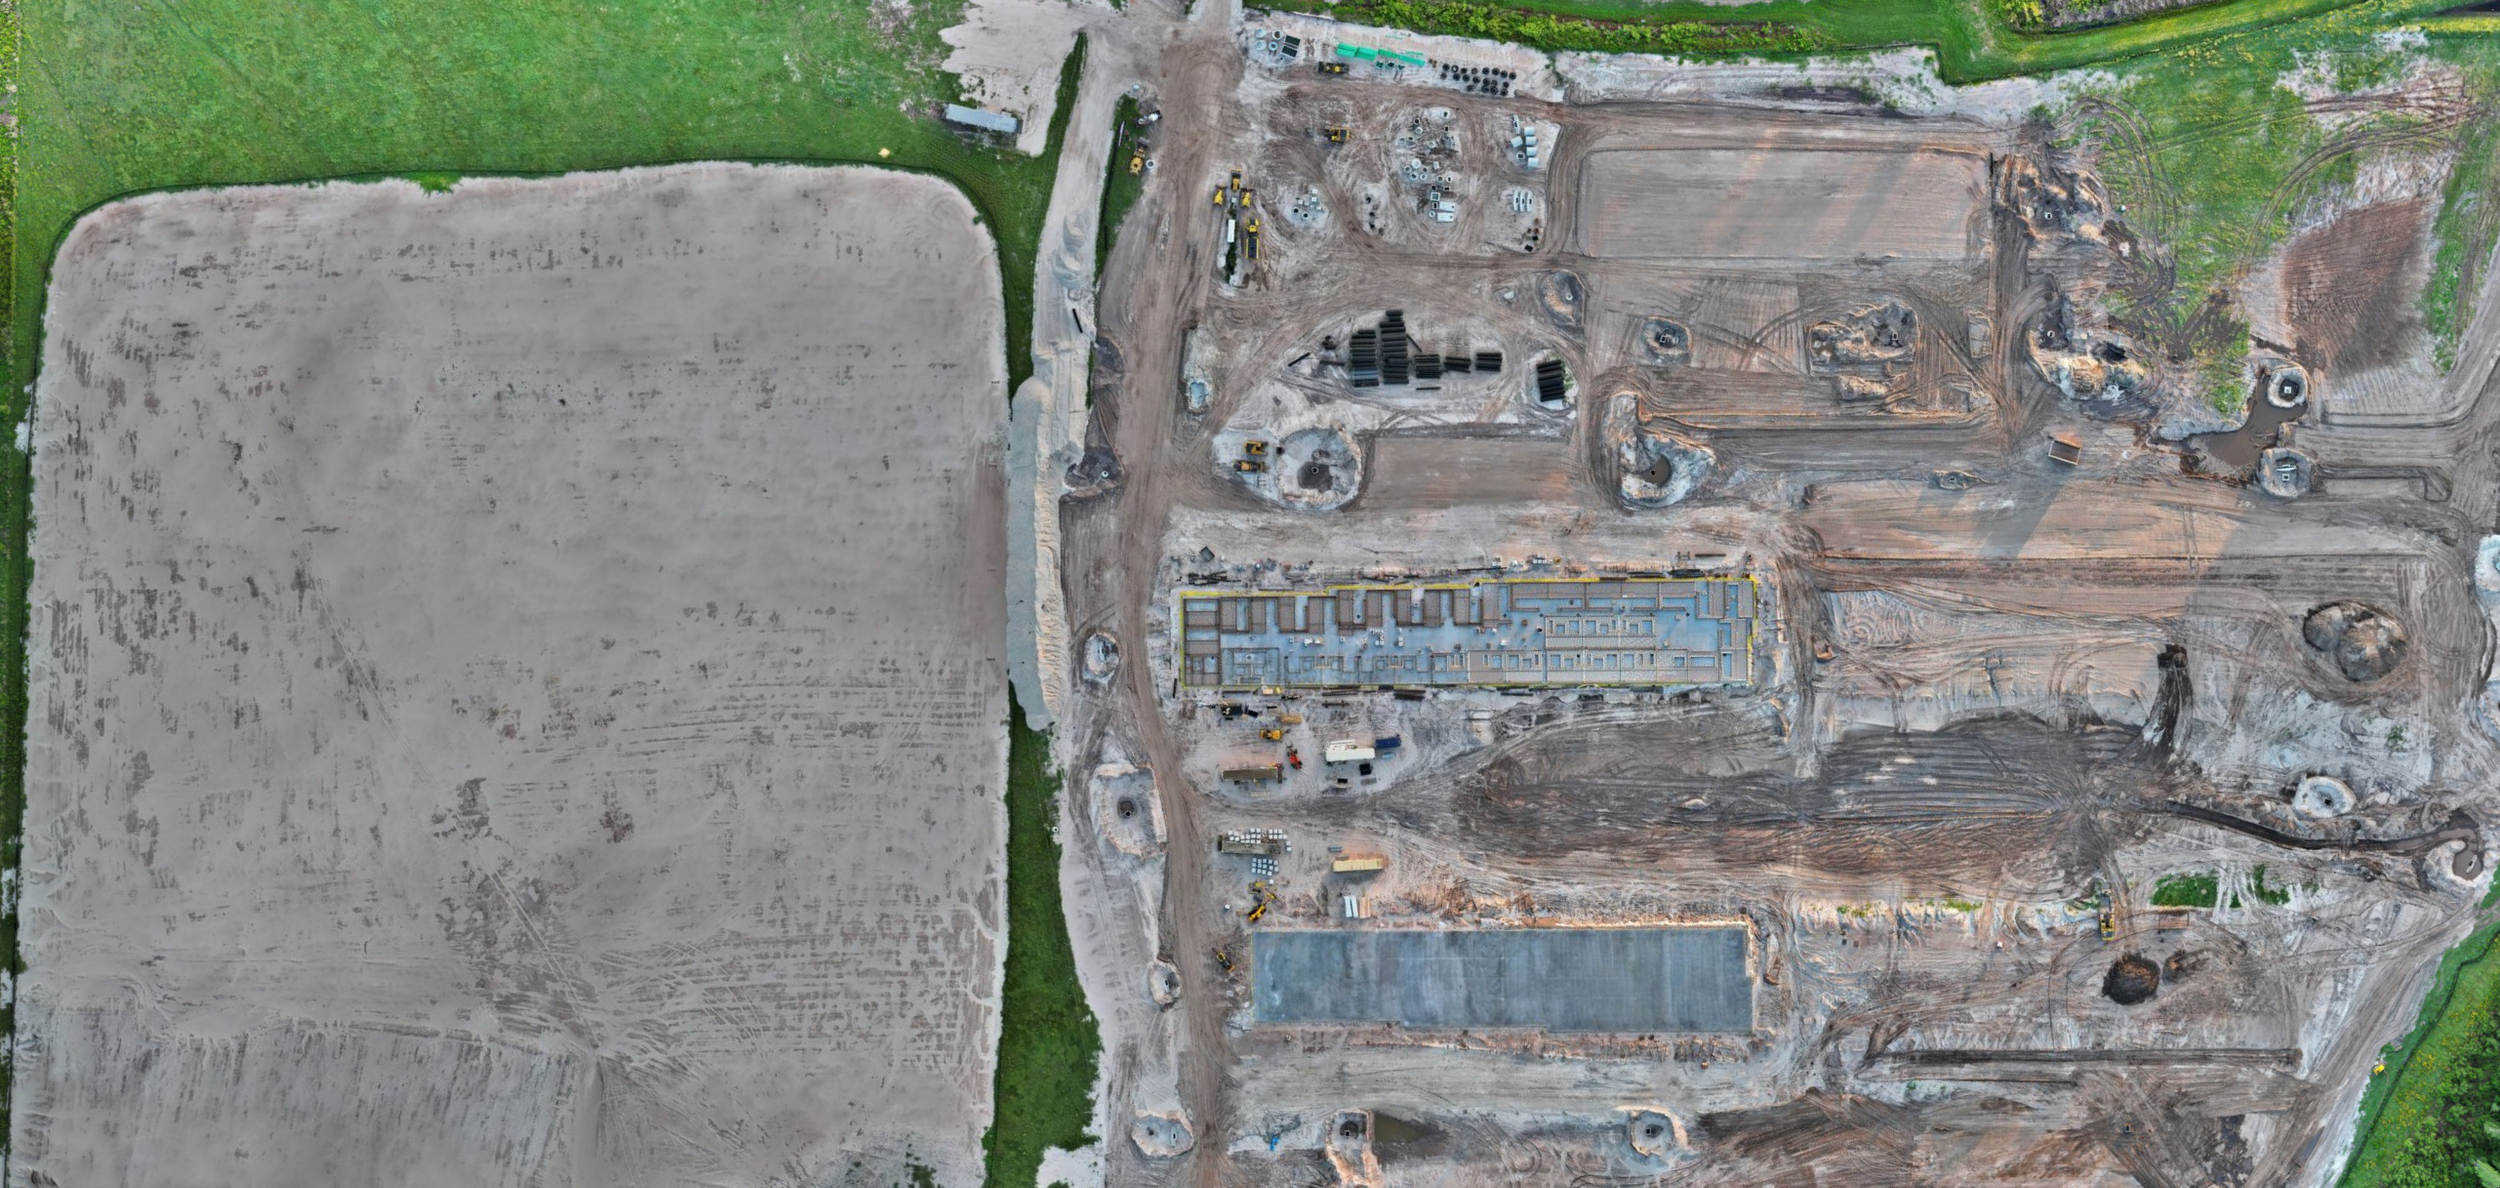
What Is a 2D Orthomosaic? The Aerial Map Changing How Construction Sites Are Documented.
Learn what a 2D orthomosaic is, how it's made, and why construction teams use drone-generated aerial maps for site documentation, progress tracking, and measurements.
The Short Version
A 2D orthomosaic is a highly detailed, geometrically corrected aerial map built from hundreds, sometimes thousands, of individual drone images. Unlike a single photograph taken from the sky, an orthomosaic is stitched together, corrected for distortion, and scaled to real-world measurements. Every pixel is accurate. Every measurement is reliable.
Think of it as a blueprint-quality aerial photograph of your entire site. One image, fully measurable, updated as often as you need it.
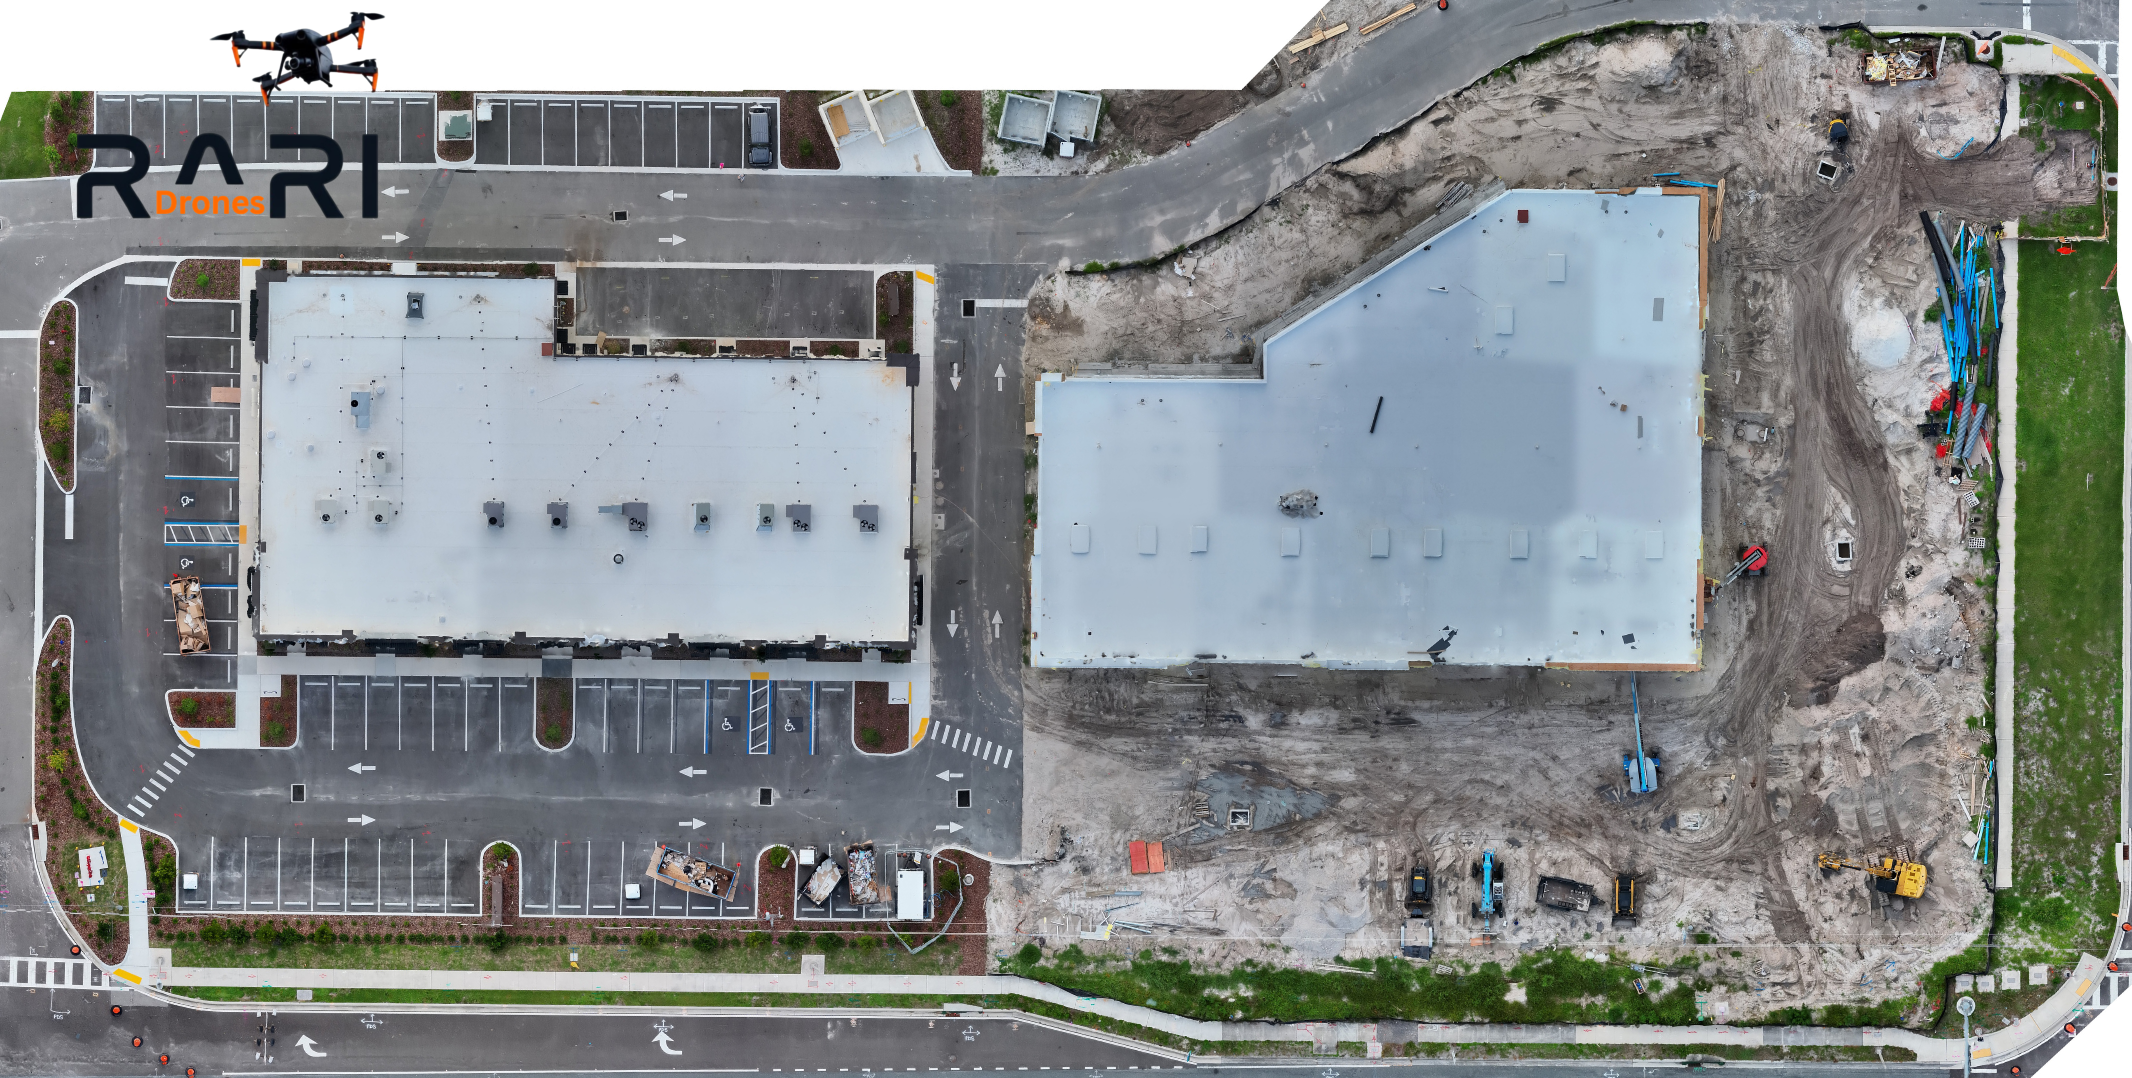
2D Orthomosaic of a construction site in Wesley Chapel, FL generated from drone imagery by RARI Drones.
How It's Made
Building an orthomosaic isn't as simple as flying a drone over a site and snapping a photo. It's a structured process:
Flight Planning: Before the drone ever leaves the ground, the pilot programs a precise grid pattern over the site using professional mapping software. The flight plan controls altitude, speed, overlap between images, and camera angle; all optimized for accuracy.
Image Capture: The drone flies the programmed mission autonomously, capturing overlapping images across the entire site. A typical 10-acre site can generate 400 to 800+ images in a single flight. Each image is geotagged with GPS coordinates, and when RTK (Real-Time Kinematic) positioning is used, that accuracy reaches sub-centimeter levels.
Processing: Specialized photogrammetry software analyzes every image, identifies common features between overlapping photos, and stitches them into a single, seamless map. During this process, the software corrects for lens distortion, terrain elevation changes, and camera angle variations, producing a geometrically accurate, orthorectified image.
The result: One massive, high-resolution aerial map where distances, areas, and features can be measured directly. No guesswork. No estimation.
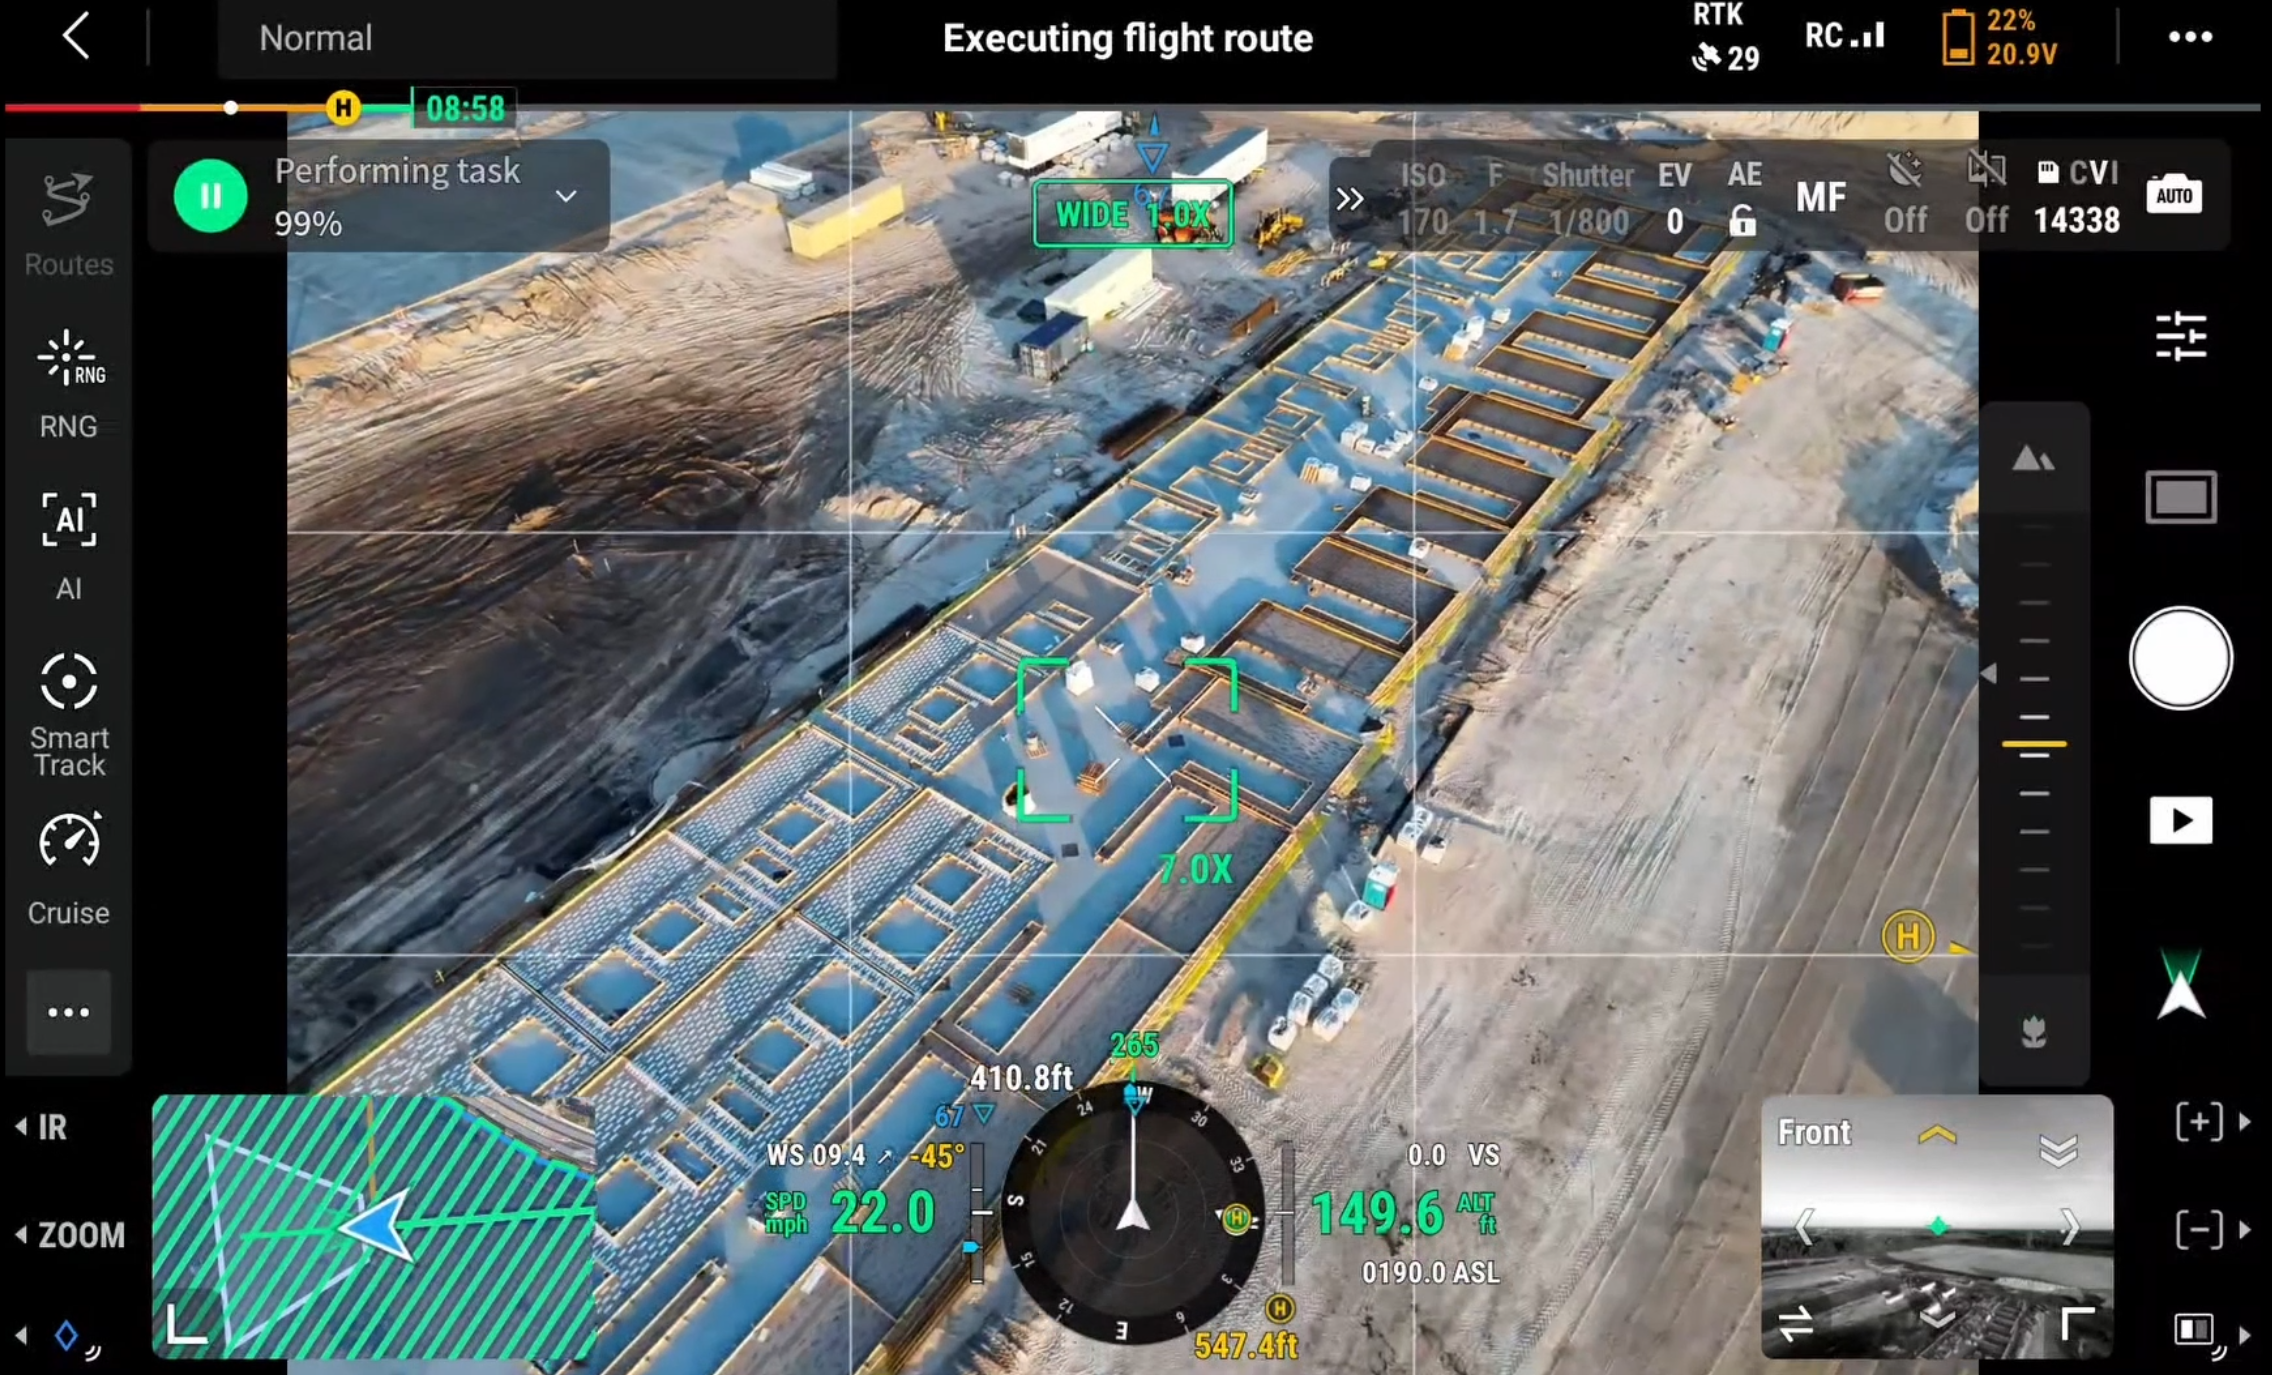
DJI drone controller screen showing automated mapping flight plan over a 71-acre construction site in Tampa Bay, FL.
Why It Matters for Construction
A single drone photo looks impressive. An orthomosaic is actually useful. Here's the difference:
Accurate Measurements: Need to measure a building footprint, a cleared area, or the distance between two points on site? Measure directly on the orthomosaic. The measurements are real.
Progress Documentation: Fly the same mission weekly, and you build a timeline of your project from start to finish. Compare this week's map to last week's and see exactly what changed. What was poured, what was graded, what was erected. Every phase, documented.
Stakeholder Communication: Send a superintendent, project manager, or investor a single link to an interactive map they can zoom, pan, and explore from their desk. No site visit required to see exactly where things stand.
Dispute Resolution: When questions come up about timelines, site conditions, or work completed, a dated orthomosaic is documented evidence. Not someone's memory of how the site looked.
GeoTIFF Export: Orthomosaics can be exported as GeoTIFFs, georeferenced image files that drop directly into CAD, GIS, and project management platforms with full coordinate accuracy. Your engineers and surveyors can overlay the aerial map on site plans immediately.
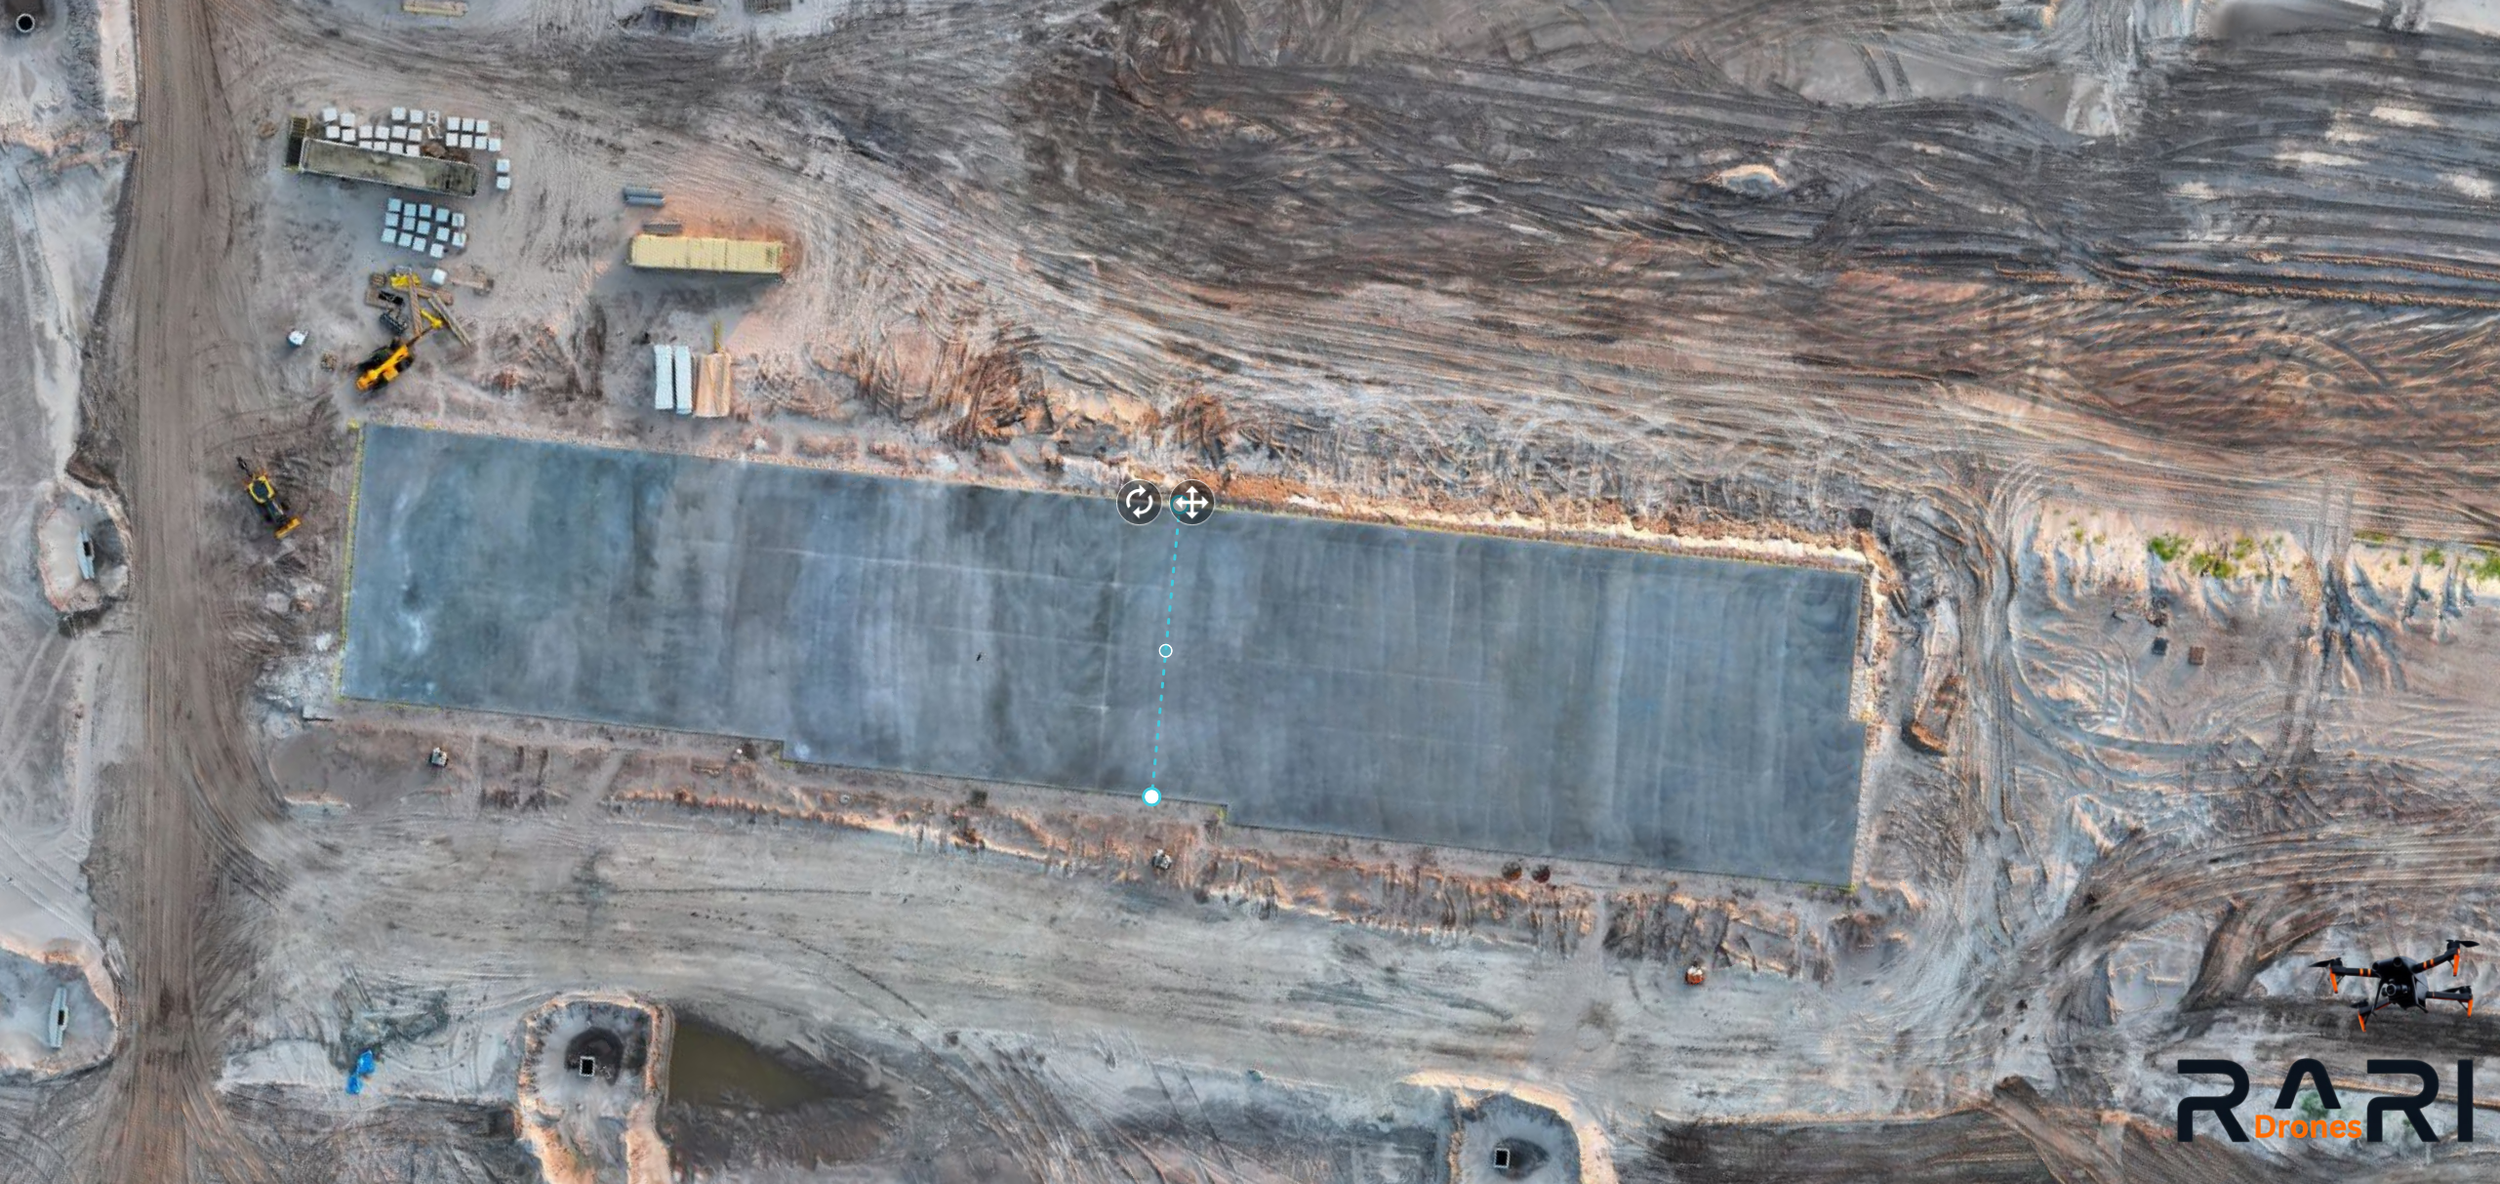
DroneDeploy measurement tool demonstrating distance measurement capability on a 2D orthomosaic.
What You Actually Get
When RARI Drones delivers a 2D orthomosaic, you're not just getting one file. A typical deliverable package includes:
High-resolution orthomosaic: the full aerial map.
Interactive map link: shareable, zoomable, accessible from any browser.
GeoTIFF: georeferenced file for CAD/GIS integration.
Digital Surface Model (DSM): elevation data across the entire site.
KMZ file: overlay in Google Earth.
Detail shots: close-up images of specific areas of interest.
Everything is processed, organized, and delivered within 48 hours.
How It Compares
How does an orthomosaic compare to a standard drone photo?
Single Drone Photo:
Not measurable
Not geometrically accurate
Partial site coverage
Inconsistent framing between flights
Can't export to CAD or GIS
No interactive sharing
2D Orthomosaic:
Fully measurable
Geometrically accurate
Complete site coverage
Exact same mission repeatable every time
Exportable to CAD/GIS as a GeoTIFF
Shareable interactive map link
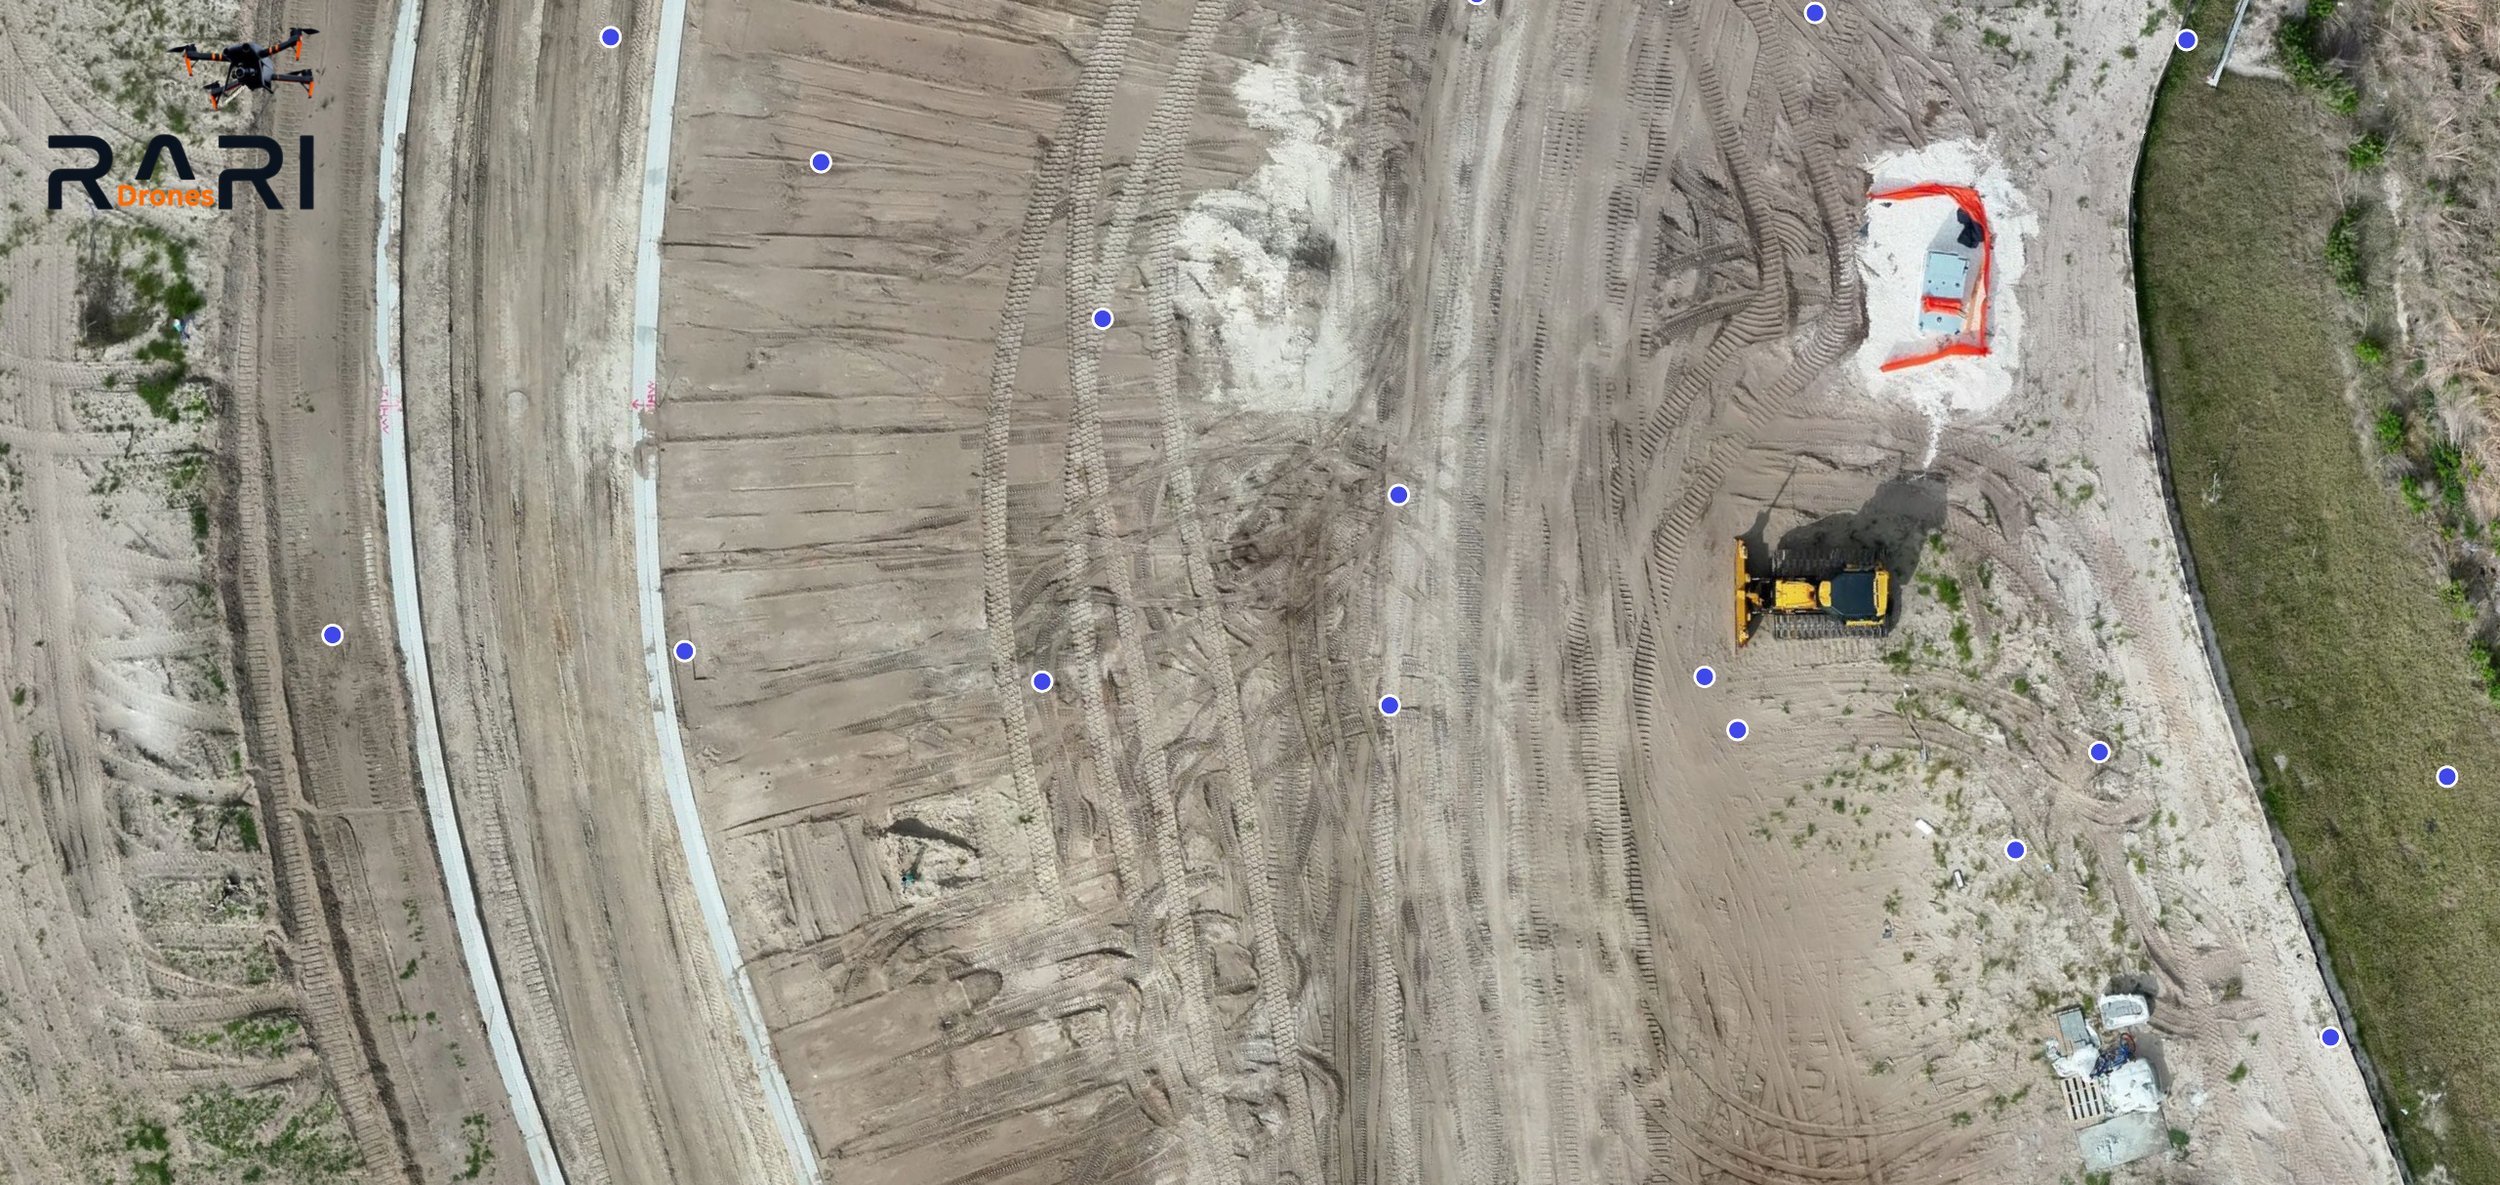
DroneDeploy 2D orthomosaic with image capture points, showing individual drone photos used to build the aerial map.
Who Uses Orthomosaics?
General Contractors: Weekly progress documentation, owner updates, pre-construction baselines.
Project Managers: Remote site monitoring, coordination between trades.
Developers: Investor updates, marketing materials, due diligence documentation.
Civil Engineers: Site plan overlays, grading verification, as-built comparisons.
Insurance & Legal: Date-stamped documentation for claims and disputes.
The Bottom Line
An orthomosaic turns a construction site into a measurable, shareable, documented asset. It's not a photo, it's data. And when you fly it weekly, it becomes a complete visual record of your project from dirt to done.
RARI Drones
Professional drone mapping and inspection services throughout the Tampa Bay area.
📞 877-606-RARI
🌐 www.raridrones.com
FAA Part 107 Licensed | RTK-Enabled for Sub-Centimeter Accuracy
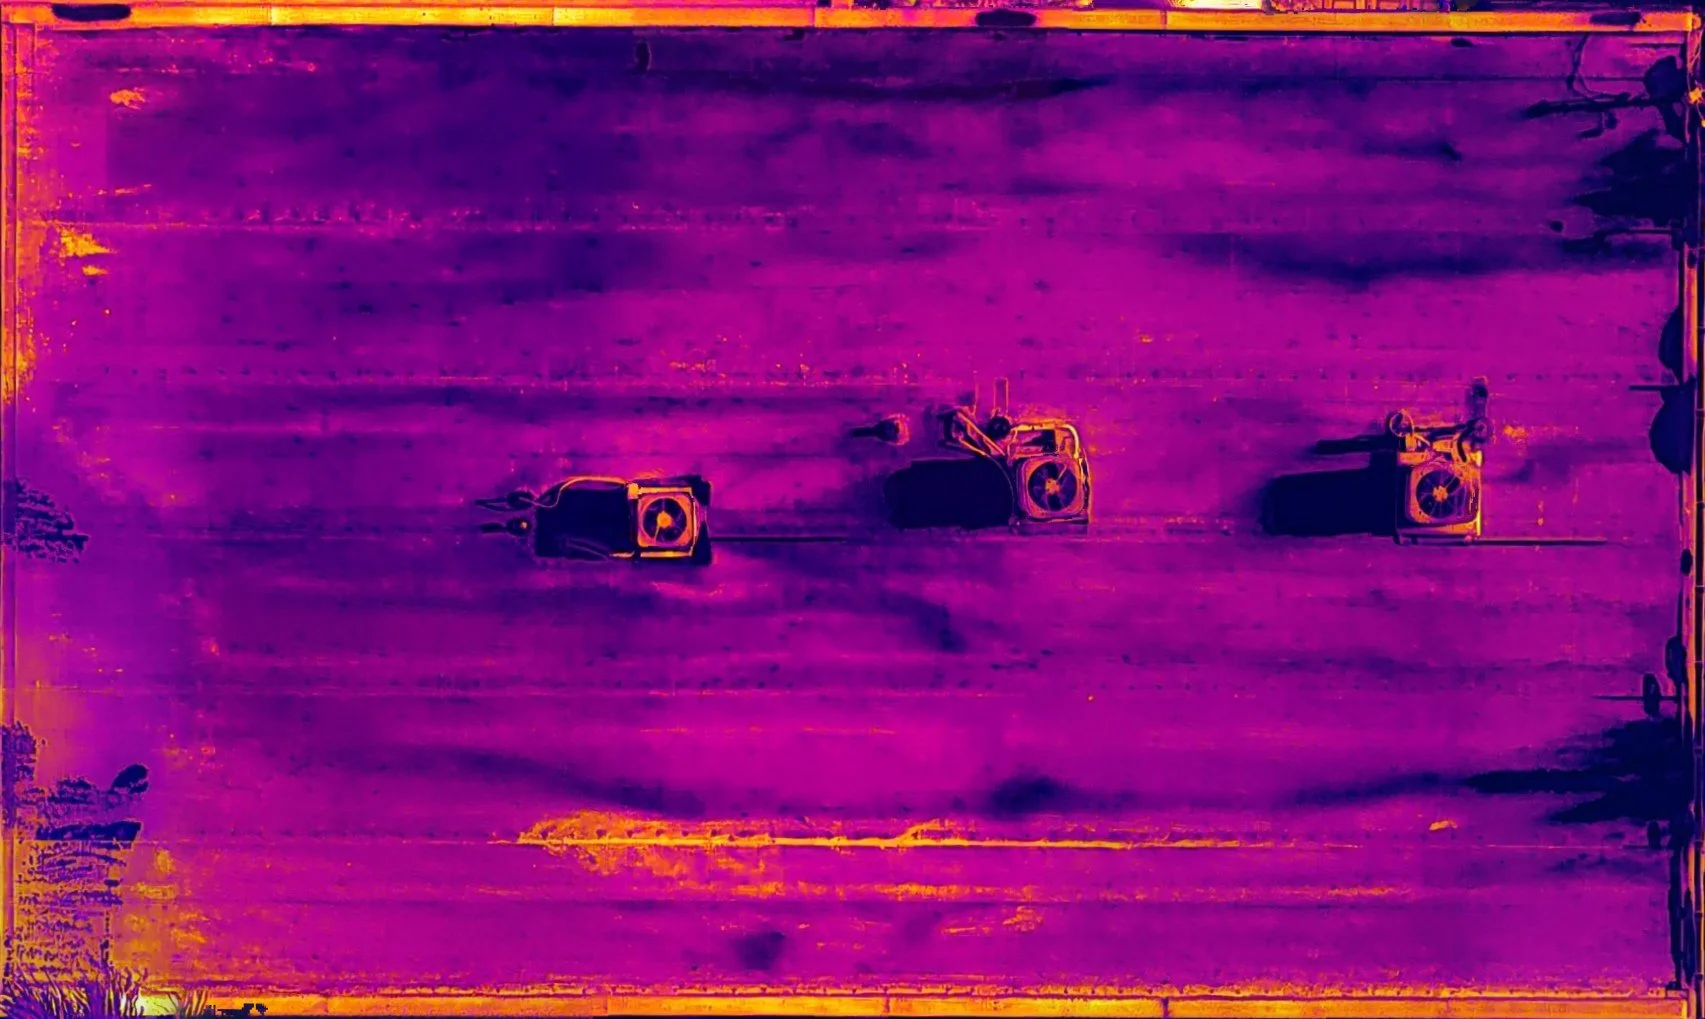
Thermal Drone Roof Inspections: How Infrared Imaging Detects Hidden Roof Damage
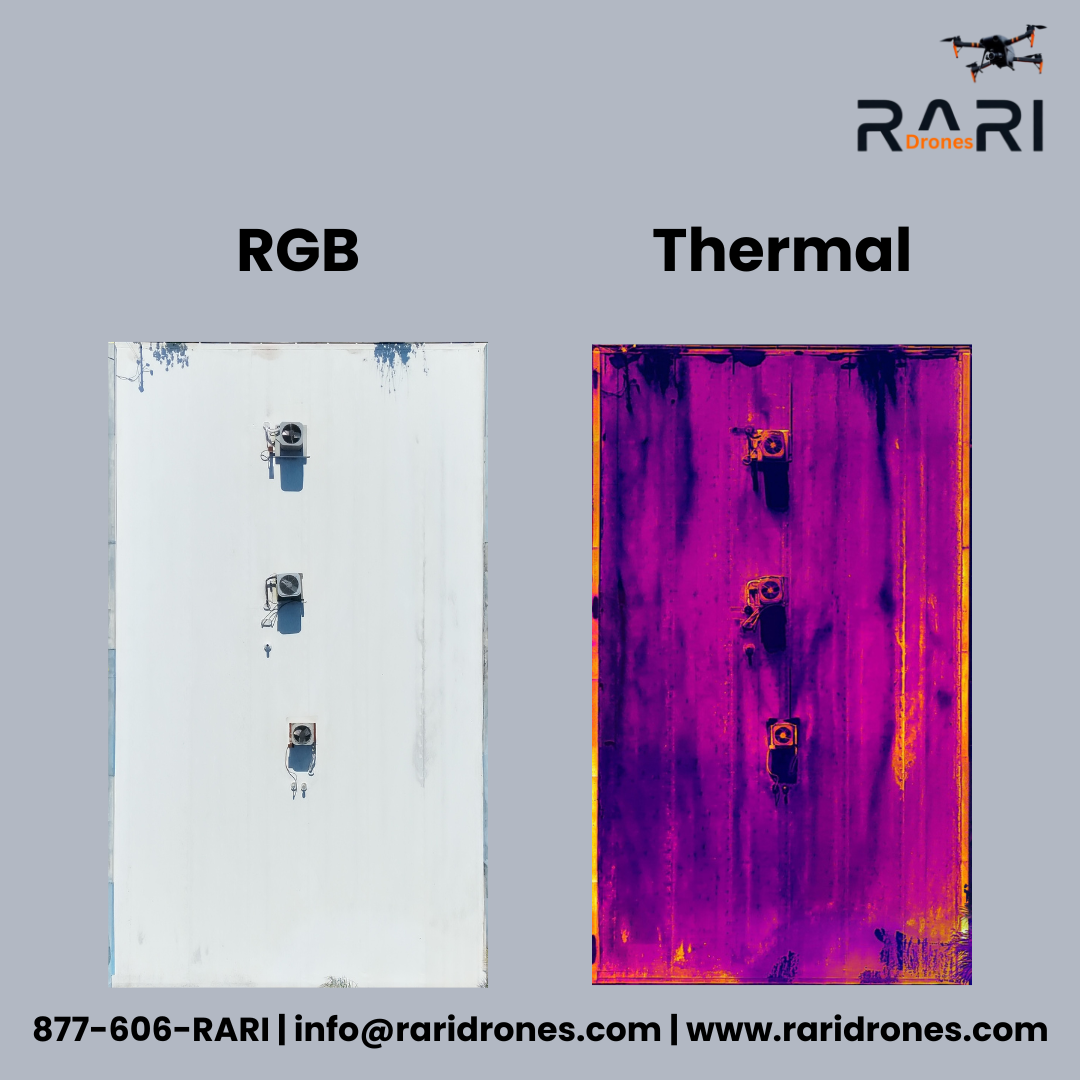
RGB vs. Thermal drone roof inspection. Thermal imaging reveals hidden moisture and possible insulation failures invisible to standard photography.
What Is a Thermal Drone Roof Inspection?
A thermal drone roof inspection uses an infrared camera mounted on a professional drone to detect temperature differences across a roof's surface. These temperature variations reveal problems hidden beneath the surface like moisture intrusion, insulation failures, trapped heat, and active leaks. These problems are completely invisible to the naked eye and a standard camera.
At RARI Drones, we use the DJI Matrice 4TD, a professional-grade platform equipped with both a high-resolution RGB camera and a radiometric thermal sensor. This allows us to capture standard visual imagery and thermal data simultaneously during every flight, giving property owners and roofing professionals the complete picture.
Why Thermal? What Your Eyes Can't See.
A traditional visual roof inspection, whether from a ladder or a drone, can only identify surface-level damage: missing shingles, cracked tiles, and visible wear. That's important, but it's only half the story.
The real threats to a roof are often hidden underneath. Moisture trapped beneath the membrane, insulation that's compressed or missing, or a slow leak that won't show up on the ceiling for possibly months, but is already rotting the decking from the inside out.
Thermal imaging detects these issues because wet or damaged materials retain and release heat differently than dry, healthy ones.
After a full day of sun exposure a roof heats up. As it cools in the evening, areas holding moisture cool at a different rate than the surrounding dry material. That temperature contrast shows up clearly on thermal imaging, even when the surface looks perfectly fine.
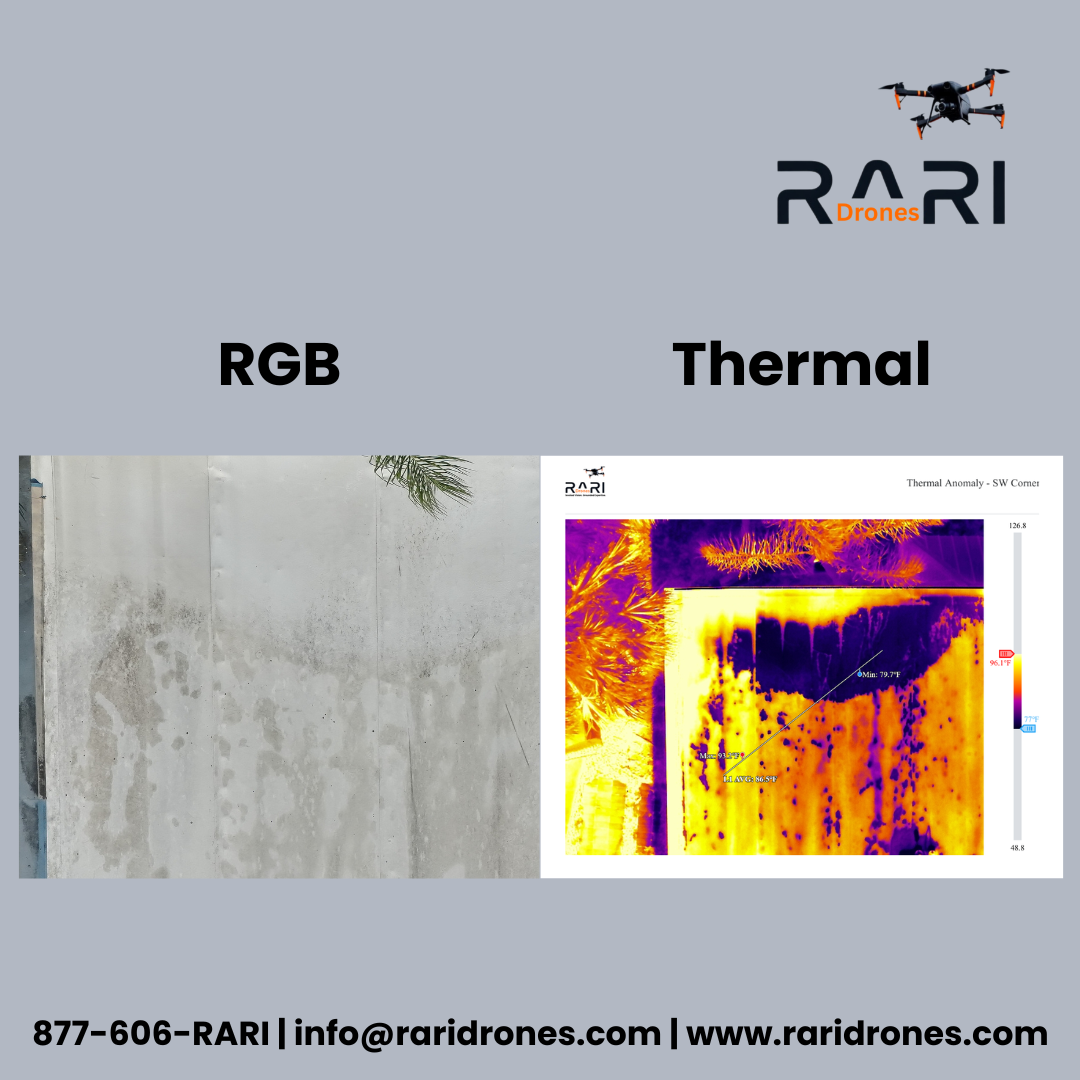
Thermal analysis of a commercial roof corner. Temperature differentials reveal possible moisture intrusion invisible in the standard RGB image.
That's why we fly thermal missions at specific times: early morning or after sunset, when the temperature differential between wet and dry areas is at its peak.
What Can Thermal Imaging Detect on a Roof?
Thermal drone inspections can identify a range of issues that would otherwise go undetected until serious damage has already occurred.
Moisture Intrusion & Trapped Water: The most common finding. Water trapped beneath roofing membranes, under tiles, or in the decking shows up as distinct warm or cool anomalies depending on the time of day. Left undetected, trapped moisture leads to mold, rot, and structural failure.
Active Leaks: A thermal scan can pinpoint exactly where water is entering, even when the interior ceiling stain is ten feet away from the actual breach. Water travels along decking and structural members before it drips. Thermal imaging shows you the source, not just the symptom.
Insulation Deficiencies: Missing, compressed, or water-damaged insulation creates hot spots on the roof surface. These areas mean higher energy bills and accelerated wear on the roofing material above them. Thermal imaging maps these deficiencies across the entire roof in a single flight.
Ponding Water: Flat and low-slope commercial roofs are especially susceptible to standing water. Thermal imaging reveals areas where water is collecting even after it has partially evaporated, identifying drainage problems before they cause membrane failure. Our thermal inspection methodology follows ASTM C1153, the industry standard practice for locating wet insulation in roofing systems using infrared imaging.
HVAC & Mechanical Issues: Thermal scans can reveal HVAC equipment that's leaking conditioned air, failing seals around rooftop penetrations, and exhaust systems creating abnormal heat patterns that accelerate roof degradation in localized areas.
Flashing & Penetration Failures: Every pipe, vent, skylight, and HVAC unit that penetrates the roof surface is a potential failure point. Thermal imaging highlights compromised flashing and sealant failures around these penetrations.
RGB + Thermal: The Full Picture.
We never deliver thermal data alone. Every RARI Drones roof inspection includes both RGB (standard visual) and thermal imagery, because each tells a different part of the story.
RGB captures what you can see: physical damage, missing materials, debris, biological growth, and overall roof condition. Thermal captures what you can't see: moisture, heat loss, insulation gaps, and subsurface failures.
When you compare the two, you get a complete diagnostic picture. You can see exactly WHERE the damage is on the visual image and WHAT is happening beneath the surface on the thermal image. Our reports present these side by side with annotations so there's no guesswork, just clear and actionable data.
How Do We Fly a Thermal Roof Inspection?
Our thermal inspection workflow is designed to maximize data quality:
1. Pre-Dawn or Post-Sunset Arrival: We schedule thermal flights during the optimal window when temperature differentials are most pronounced. This often means we're set up and flying before sunrise.
2. Thermal Mapping Mission: After creating the flight plan, the drone flies a systematic grid pattern over the entire roof, capturing overlapping thermal images that are processed into a complete thermal orthomosaic. A single, measurable, high-resolution thermal map of the entire roof.
3. Thermal Detail Shots: After the mapping mission, we perform a manual scan of the roof using split-screen RGB and thermal. When we spot an anomaly, we isolate it in full-screen thermal, zoom tight, and capture a detailed shot with temperature data intact.
4. RGB Mission: Once the sun is up, we fly a standard RGB mapping mission and capture detailed visual images of any physical damage, wear, or areas of concern.
5. Processing & Reporting: All data is processed and compiled into a professional report with annotated imagery, temperature readings, GPS-stamped locations, and clear findings. Reports are delivered within 48 hours.
The result: one visit, two missions, and a complete diagnostic package that no ladder inspection or visual-only drone flight can match.
15 Years of Reading Thermal, Not Just Flying a Drone.
Here's what makes RARI Drones different from other drone operators offering thermal services.
Most drone pilots learned thermal imaging from a weekend course. They can fly the drone and capture the images, but interpreting what those images actually mean is an entirely different skill.
I'm Patrick Donovan, owner and operator of RARI Drones, and a retired Firefighter/Paramedic with over 15 years of hands-on thermal imaging experience. In the fire service, thermal imaging isn't a nice-to-have, it's a lifesaving tool. I used thermal cameras to locate victims in zero-visibility conditions, detect fire behind walls and above ceilings, identify structural hot spots, and make real-time decisions where seconds mattered.
That experience doesn't disappear when you change industries. The same principles that allow a firefighter to read heat signatures through a burning structure apply directly to reading moisture patterns, insulation failures, and thermal anomalies on a roof. The sensor is the same. The principles are the same. The difference is 15 years of doing it when lives were on the line versus learning it from a tutorial.
When RARI Drones delivers a thermal report, the analysis comes from someone who has spent over a decade and a half interpreting thermal data in the most demanding conditions imaginable.
Who Benefits from Thermal Roof Inspections?
Roofers & Contractors: Thermal data helps you diagnose problems accurately, scope repairs precisely, and justify your recommendations to customers with hard evidence. This allows you to show your client exactly where the moisture is and exactly what needs to be addressed.
Insurance Adjusters: Thermal imaging provides objective, measurable data to support or evaluate claims. Temperature readings, GPS coordinates, and annotated imagery create documentation that holds up. Combined with RGB imagery, thermal reports give adjusters the complete picture they need to process claims accurately and efficiently.
Property Managers & HOAs: Managing multiple roofs across a portfolio? Thermal inspections allow you to prioritize repairs and budget for replacements based on actual condition data, not just age or visual appearance.
Commercial Building Owners: Large flat roofs are expensive to replace and prone to hidden moisture accumulation. A thermal scan can identify problem areas early, allowing targeted repairs instead of full replacement, saving thousands.
Florida Roofs and Why Thermal Matters.
Florida's climate is uniquely hard on roofs. Intense UV exposure, daily summer thunderstorms, hurricane-force winds, hail, and year-round humidity create a relentless cycle of stress that accelerates roof deterioration.
Here in Tampa Bay, a roof that looks fine with the naked eye or with a high-resolution image, could be holding trapped moisture from last week's afternoon storm. That moisture sits under the membrane in 95+ degree heat, creating the perfect environment for mold, rot, and structural decay. By the time it shows up as a water stain on your ceiling, the damage could have been spreading for months.
Thermal imaging catches these problems early, often months to even years before they become visible. In a state where roof condition directly impacts your insurance coverage and premiums, knowing the true condition of your roof isn't optional, it's essential.
Schedule Your Thermal Roof Inspection:
RARI Drones proudly serves Tampa Bay and the surrounding counties of Pasco, Hillsborough, Pinellas, and Hernando. Whether you're a roofer who wants better diagnostics, or an adjuster who wants solid documentation, we deliver professional-grade Thermal and RGB inspection data you can trust.
📞 877-606-RARI
🌐 www.raridrones.com
RARI Drones provides aerial thermal and visual imaging services for documentation and diagnostic support. We are not licensed home inspectors, roofing contractors, or structural engineers. Our reports are intended to identify and document thermal anomalies and visible conditions. They do not constitute a home inspection, structural assessment, or warranty evaluation. All findings should be reviewed by the appropriate licensed professional for final diagnosis and repair recommendations.
All flights are conducted in full compliance with FAA Part 107 regulations.
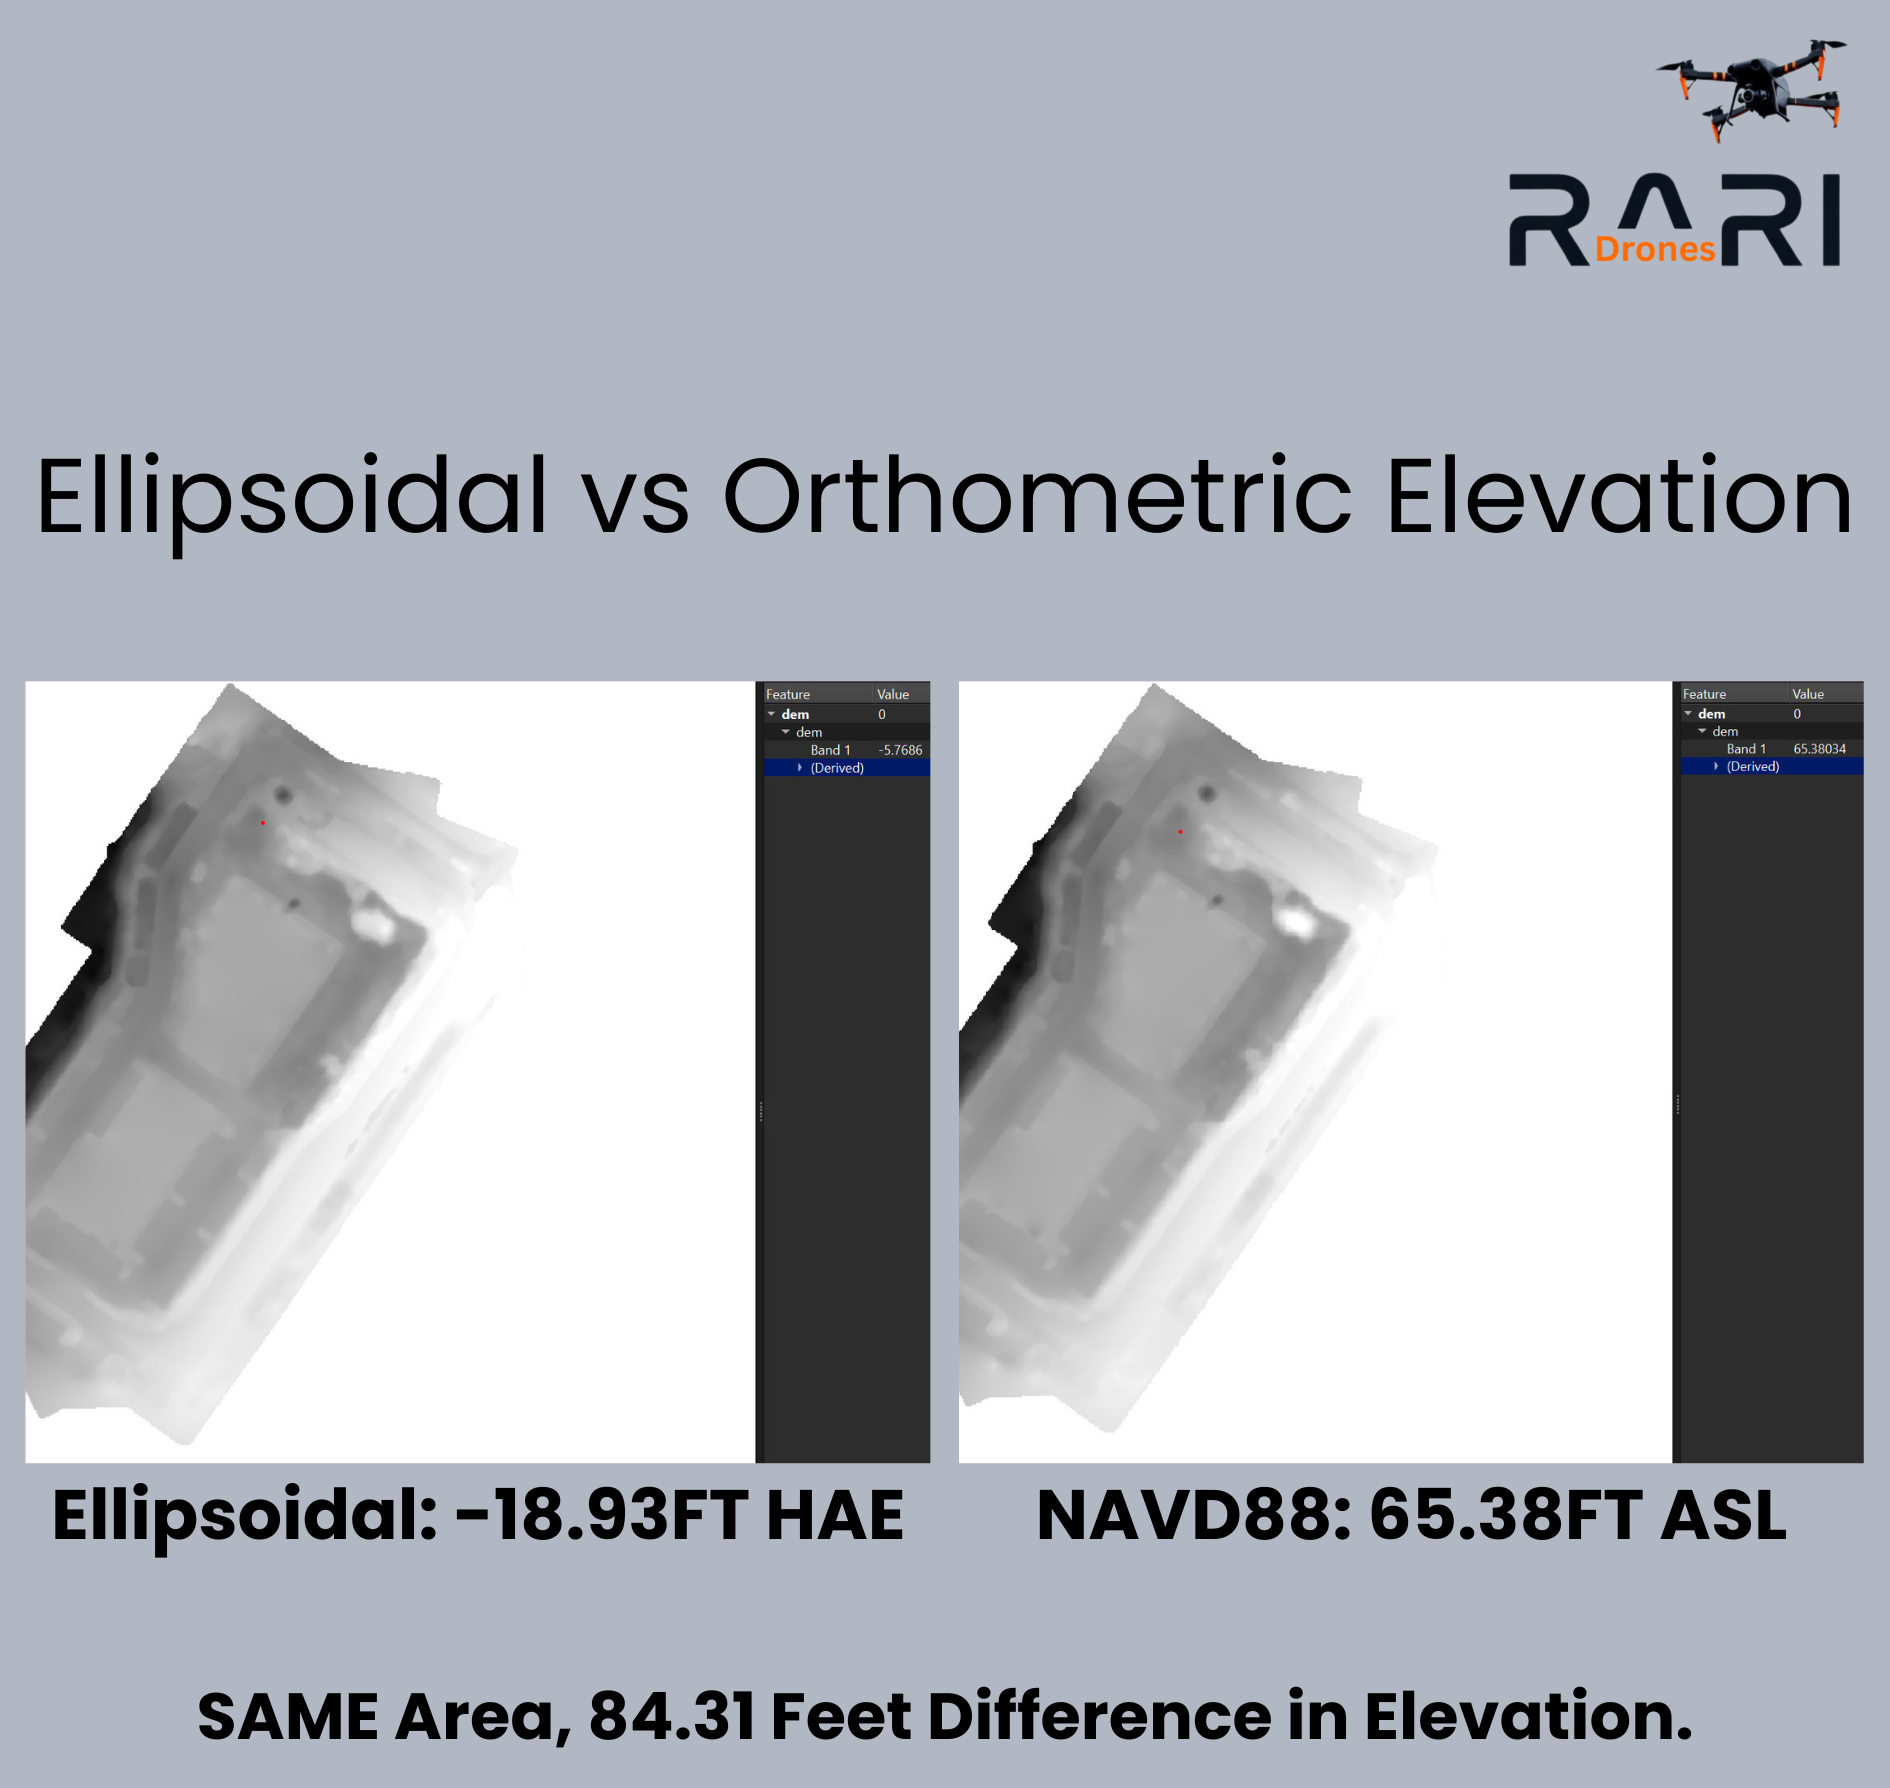
Ellipsoidal vs. Orthometric Elevation: Why It Matters in Drone Mapping
Same site. Same flight. Same image set. 84 ft apart. Here's why elevation accuracy matters in drone mapping.
Same site. Same flight. Same image set. 84 ft apart.
If that sounds impossible then keep reading, because this is one of the most overlooked details in drone mapping, and it can make or break the accuracy of your site documentation.
The Problem Most People Don't Know Exists:
I was having a conversation with a friend about what I do, and I used this as an example of why the details matter in aerial mapping.
Some drone mapping software exports elevation data in ellipsoidal heights by default. That's the raw GPS measurement, called Height Above Ellipsoid (HAE). It's the number your drone's GPS receiver calculates based on its position relative to a mathematical model of the Earth's shape.
The problem? It doesn't match the real world.
84 Ft - From the Same Data, at the Same Location:
Below are two elevation readings from the same site here in the Tampa Bay area. Same flight, same images, same data, just processed differently.
Ellipsoidal (HAE): -18.93 ft. At face value, that looks like the site is nearly 19 feet underground. I assure you, it's not.
Orthometric (NAVD88): 65.38 ft above sea level. A real-world elevation that aligns with what surveyors and engineers actually work with.
The difference? 84.31 ft. That's roughly the height of an 8-story building, from the exact same data.
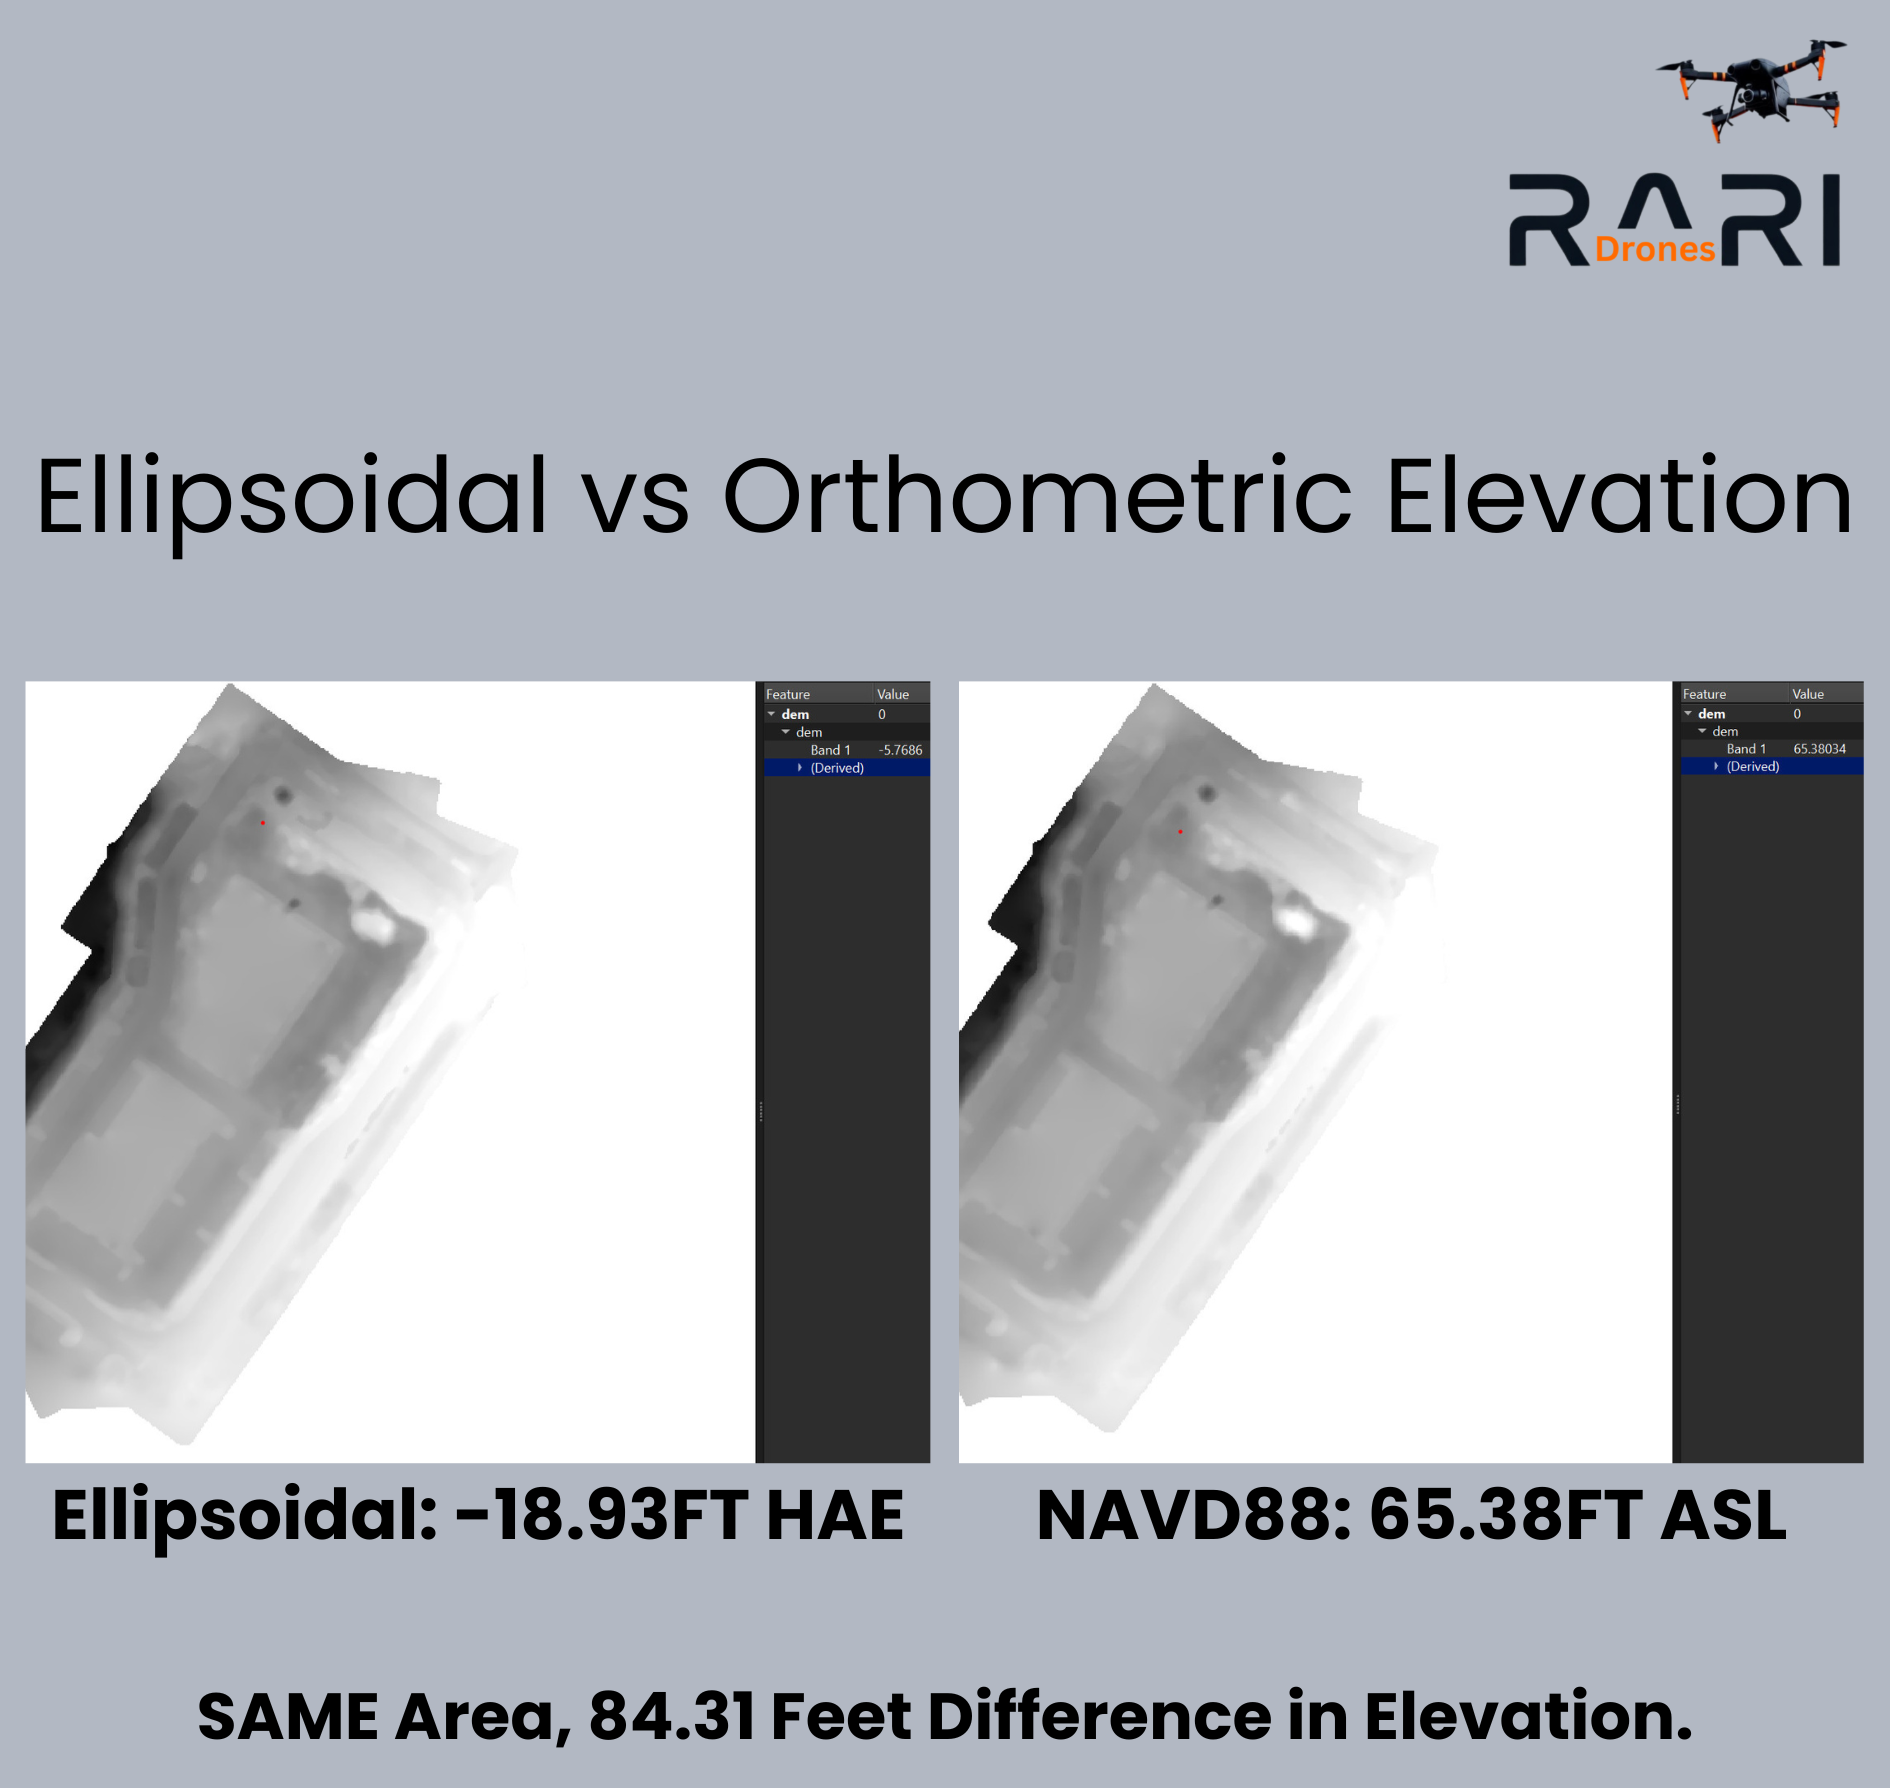
Wesley Chapel, FL - Ellipsoidal (HAE) vs. Orthometric (NAVD88)
So What's Actually Going On?
The Earth isn't a perfect sphere. GPS satellites measure your position relative to a smooth mathematical surface called the ellipsoid. Think of it as a simplified, idealized shape of the planet.
But the real world has gravity variations, landmasses, ocean trenches, and uneven terrain. The actual surface where water would settle at rest, sea level, doesn't follow that smooth ellipsoid. It follows what's called the geoid, an irregular surface shaped by gravity.
The difference between the ellipsoid and the geoid at any given point is called the geoid undulation. In the Tampa Bay area, that difference is approximately 84 feet.
That's why the raw GPS elevation says -18.93 feet (below the ellipsoid) while the real-world elevation is 65.38 feet above sea level. Neither number is "wrong", they're just measured from different references.
Why This Matters for Your Project:
If elevation data is part of your site documentation for grading, drainage, progress tracking, or compliance, then it needs to match the real world. Your engineers, surveyors, and project managers are working in orthometric heights. If you hand them ellipsoidal data without converting it, the numbers won't align with their plans, their benchmarks, or reality.
Here's where it gets real:
Cut and fill calculations based on ellipsoidal heights will be off by the full geoid undulation, in our area, that's 84 ft of error.
Drainage and grading plans reference NAVD88. Ellipsoidal data won't match the civil drawings.
Progress reports with inconsistent elevation references create confusion and liability.
FEMA flood maps and elevation certificates use NAVD88. Ellipsoidal heights are meaningless in that context.
How We Handle It:
At RARI Drones, every deliverable is processed using NAVD88 orthometric heights (US Survey Feet) with the GEOID18 model. This is the same vertical datum used by surveyors, engineers, and federal agencies across the United States. Combined with RTK correction through the Florida DOT CORS network, our mapping data achieves sub-centimeter horizontal accuracy and reliable vertical positioning. Data that integrates directly with your existing site plans and survey benchmarks.
We don't deliver raw GPS numbers and call it a day. We deliver data that matches the real world.
The Bottom Line:
Ellipsoidal vs. Orthometric Elevation isn't just a technical footnote, it's the difference between data your team can use and data that creates confusion. In this case, that "small detail" was an 8-story building.
If you need accurate, survey-grade drone mapping for your construction site, we'd love to talk.
RARI Drones
Professional drone mapping and inspection services throughout the Tampa Bay area.
📞 877-606-RARI
🌐 www.raridrones.com
FAA Part 107 Licensed | RTK-Enabled Sub-Centimeter Accuracy